McGraw Hill
Arthropods
Are spiders related to crabs? Study the order of arthropods with a reading selection about animal diversity. It provides details about each class within the order, as well as vivid pictures and explanatory charts.
American Chemical Society
Norbert Rillieux, Thermodynamics and Chemical Engineering
The man who invented the earliest examples of chemical engineering was an American-born, French-educated, free man of color before the Civil War, and went on to translate Egyptian hieroglyphics. There is something of interest for almost...
Mathed Up!
Negative Numbers
Individuals read tables with temperatures and times in order to distinguish the town with the lowest temperature or most extreme temperature difference. Each of the eight questions has three sub-questions that use the same charts.
University of California
Energy and Biomass Pyramids
Young scientists play tag as they act out the food pyramid in the ocean ecosystem. Energy circles pass from the smaller prey to the predators and at the end of the activity, a data chart and analysis questions allow pupils to apply their...
Arkansas Government
Creative Adventures with Literature - Whoever You Are
Celebrate our similarities and differences through multiple readings of Whoever you Are by Mem Fox. Readings are accompanied by a grand discussion, charts, creative art, dramatic, and music play to reinforce the uniqueness that is found...
Savvas Learning
"The Digestive Process Begins" and "Final Digestion and Absorption"
Want your class to digest text more thoroughly? Middle schoolers learn about the digestive system in the lesson and reinforce informational text reading skills through a variety of strategies. They engage in a close reading approach,...
Ontario
Reading Graphic Text
Do students really need to be taught how to read cartoons, comic books, and comic strips? Yes. Just as they need to learn how to read other forms of graphic text such as diagrams, photos, timetables, maps, charts, and tables. Young...
It's About Time
Mass Extinction and Fossil Records
The focus of a fossil-based lesson uses graphs and charts that allow young paleontologists to make inferences about events of mass extinction. They must apply their previous knowledge about fossil records in this final lesson of the...
Virginia Department of Education
Levels of Cellular Organization
What an eccentric way to learn about each level of cellular organization! Allow emerging biologists to utilize white paper and create their own foldable charts to describe each level of organization in the body. You may also adapt the...
Willow Tree
Circle Graphs
Pie isn't just for eating! Scholars learn to create pie charts and circle graphs to represent data. Given raw data, learners determine the percent of the whole for each category and then figure out the degree of the circle that percent...
Miami-Dade County Public Schools
Veteran's Day—Honoring All That Served
Looking for ideas on ways to recognize Veteran's Day? Check out this 92-page packet that includes exercises designed for all grade levels. Reading passages detail the history of the holiday, research projects get individuals involved in...
National Wildlife Federation
By Air, Land, or Sea: The Formation and Location of Our Natural Resources
Coal forms from the ancient remains of plants that were alive on Earth before the dinosaurs! Scholars use their t-charts from the previous lesson plan over resources and research to determine if their information is correct. Through...
Curriculum Corner
Second Grade Summer Math Practice Book
Stop the summer lag with a set of second grade Common Core based math practice sheets. Learners fill in hundreds charts with missing numbers up to 1,000. They practice writing numbers in standard, expanded, and word form. Children also...
University of California
The Civil War: The Road to War
The United States Civil War resulted in the highest mortality rate for Americans since the nation's inception. Delve deeper into the causes for the drastic separation of states with a history lesson plan that features analysis charts,...
Virginia Department of Education
May I Have Fries with That?
Not all pie graphs are about pies. The class conducts a survey on favorite fast food categories in a lesson on data representation. Pupils use the results to create a circle graph.
Channel Islands Film
Human Impact on the Food Web of Santa Cruz Island
What happens when a non-native species is introduced onto an island? Santa Cruz Island, part of the Channel Island chain located off the coast of southern California, provides the perfect laboratory for young environmental scientists to...
NASA
Eclipse Activity Guide
Ever made solar s'mores? Or recreated the solar system using peanuts? Astronomers young and old investigate all things solar using a variety of activities. Explore how the sun works, types of light it emits, and methods of charting the...
Science Matters
Ecosystem Pre-Assessment
Test scholars' knowledge of ecosystems with a 20-question pre-assessment. Assessment challenges learners to answer multiple choice questions, read diagrams, and complete charts.
Fluence Learning
Writing an Opinion Requiring Voting
Challenge writers to compose an essay detailing their stance on, and the history of, voting. Three assignments, each broken down into three parts, requires fifth graders to take notes, read and complete charts, write paragraphs, compare...
National Nanotechnology Infrastructure Network
What’s In Your Neighborhood?
Chart your way to an understanding of nanoscale. Using a Google map, learners estimate a radius around their location of 1,000 and 1,000,000 meters. Predicting what 1,000,000,000 meters would look like takes them off the charts!...
Federal Reserve Bank
The Story of the Federal Reserve: High School Lesson Plan
Is there a bank for the banks? Pupils analyze the complexities of the Federal Reserve system by breaking it down into easy-to-understand sections. Step-by-step investigation using flow charts and graphs of how the monetary system works...
Newspaper Association of America
Citizens Together: You and Your Newspaper
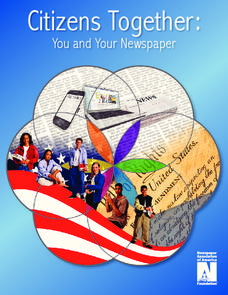
Not all news in a newspaper comes in the form of a traditional article; photographs, charts, and even editorial cartoons help spread important information, too. A civics-based unit describes the parts of the newspaper as tools for...
Mascil Project
Drug Concentration
Different medications leave the body at different rates, and how people take them determines their effectiveness. Learners investigate this effectiveness by charting the concentration of a given medication in the body. Using exponential...
New York State Education Department
Global History and Geography Examination: January 2018
Finding a test that assess knowledge of global history and geography can be challenging, but here's a resource that solves the problem. Updated January 2018, the exam asks class members to analyze charts, primary sources, and graphic...
Other popular searches
- Charts and Graphs
- Multiplication Charts
- Maps and Charts
- Tally Charts
- Pie Charts and Graphs
- Pie Chart
- Multiplication Charts to 100
- Reading Charts and Graphs
- Behavior Charts and Graphs
- Charts and Graphs Candy
- Interpret Charts and Graphs
- Charts and Graphs Christmas


