Curated OER
Compare Sets of Objects Guided Lesson
Practice math vocabulary terms fewer, more, and data using this visual-object-analysis guide. Learners observe three sets of objects and answer three questions, two of which compare numbers of objects, and the last which asks scholars to...
Curated OER
Data Chart
In this graphic organizer instructional activity, students use this blank data chart for any math or language arts purpose. There are 2 vertical columns on the chart with spaces for headings at the top.
Math Worksheets Land
Pie or Circle Graphs Problems - Independent Practice Worksheet
Third graders take a set of data and turn it into a pie graph with an independent worksheet. Containing 10 sets of data, the resource reinforced data analysis skills that pupils can use throughout a graphing unit.
Curated OER
Hundreds Charts
In this hundreds charts worksheet, students fill in the hundreds charts that are completely blank, have the 5's filled in, and have the 10's filled in. Students have 3 charts to fill in.
Bowland
German or English?
Sprechen sie Deutsch? Future cryptographers must decide whether an unknown text is written in English or in German. They use provided pie charts about the frequency of words in the English and German languages to help make their decisions.
Curated OER
Piece of Pie Chart
In this math worksheet, young scholars examine a pie graph which shows a student's homework over 2 hours. Students read the information, then use a pie chart template (divided into 24 parts) to make their own homework chart.
Howard Hughes Medical Institute
Patterns in the Distribution of Lactase Persistence
We all drink milk as babies, so why can't we all drink it as adults? Examine the trend in lactase production on the world-wide scale as science scholars analyze and interpret data. Groups create pie charts from the data, place them on a...
Curated OER
Fractions: pie graphs, numbers, and bars
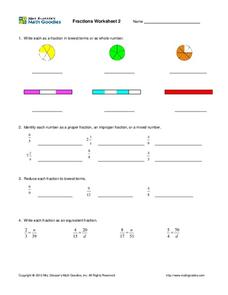
In this fraction worksheet, middle schoolers complete fraction problems containing pie graphs, numbers, bars, proper fractions, lowest terms, and more. Students complete 19 problems.
Curated OER
Four Algebraic Proof Charts
In this proof chart instructional activity, students are given an equation and asked to solve for the unknown and to justify the steps by filling in the proof using math properties. The instructional activity contains four problems...
Curated OER
Vocabulary Charts
Help your kids learn their vocabulary with a lesson plan and graphic organizer. After receiving a list of new vocabulary words, learners look up the definitions in dictionaries and fill in the worksheet. Additionally, they include a...
Laboratory for Atmospheric and Space Physics
Charting the Progress of New Horizons
In 2006, New Horizons began its mission to fly to Pluto. As it continues its journey, scholars track its progress with the help of an informative website, all the while reinforcing measurement concepts with the construction of a scaled...
Curated OER
The Economienda System
Explore the Economienda System common in Latin America during the 1700s. The class will read the included text, answer 3 critical-thinking questions, and fill out a pie chart showing the demographics of the time. They will learn about...
Curated OER
Reading Timetable
Word problems, telling time, and reading charts all come together on this page. After reviewing a table of different travel times for a bus, a tram, a taxi, and a trolley, third graders solve word problems about arrival times and stop...
Curated OER
Solar Storm Energy and Pie Graphs
In this solar storm energy and pie graphs worksheet, students solve 5 problems using pie graphs that show the amount of solar energy that is converted into radiation, kinetic energy, flare energy and flare energy that is lost to working...
Curated OER
Charts, Maps, and Graphs Lesson on the Holocaust
Students practice interpreting data. In this Holocaust lesson, students research selected Internet sources and examine charts, maps, and graphs regarding the Jewish populations in and out of Europe. Students respond to questions about...
Curated OER
Bar Graphs and Pie Charts
Students graph data they collected and analyze it using a bar graph. In this algebra activity, students analyze their data using pie charts and bar graphs while explaining the meaning to each other. They compare and contrast bar...
Curated OER
Sunshine Math-1
In this math skills worksheet, learners answer 7 questions in which they use various basic math skills. They use number lines, charts, number blocks, a calendar and a ruler to complete this worksheet.
Curated OER
The Great Pollinators
Students discover the reproductive parts of a plant. In this biology instructional activity, students identify and categorize several different plants they dissect in class. Students record their information using a data chart.
Curated OER
Percents Practice
In this decimals worksheet, students complete problems involving decimals, percents, fractions, word problems, and charts. Students complete 72 problems total.
Raytheon
Data Analysis and Interpretation
For this data analysis and interpretation worksheet, learners use charts, graphs, statistics to solve 42 pages of problems with answer key included.
Curated OER
Earth Energy Budget Pre Lab
Learners explore energy by conducting an in class experiment. In this climate change lesson, students conduct a water vapor experiment in a soda bottle. Learners utilize graphs and charts to analyze the results of the experiment and help...
San Jose Unified School District
Multiplication Chart
Looking to support your young mathematicians with mastering their multiplication facts? Then this set of multiplication charts is a great place to start, allowing children to visualize the the relationships between factors and multiples.
Haiku Deck
Haiku Deck - Beautiful Presentations and Slideshows with Charts and Graphs
Create beautiful and simple presentations, sales pitches, lessons, and visual stories that utilize Getty Images, high quality photos licensed under Creative Commons, as well as your own prints. What you create will demand people’s...
Curated OER
Games on Echolocation
Get a little batty with life science! This fun simulation game replicates how bats use echolocation to hunt moths in their native Hawaiian habitat. After creating blind folds and discussing some basic principles of echolocation, students...
Other popular searches
- Charts and Graphs
- Multiplication Charts
- Maps and Charts
- Tally Charts
- Pie Charts and Graphs
- Pie Chart
- Multiplication Charts to 100
- Reading Charts and Graphs
- Behavior Charts and Graphs
- Charts and Graphs Candy
- Interpret Charts and Graphs
- Charts and Graphs Christmas


