Curated OER
Data Analysis: For Little Learners
Using pictographs, tally charts, and surveys, kids learn all about data analysis and collection. They make surveys, collect data, then construct pictographs and tally charts to organize their information.
Curated OER
Creating Line Graphs
High schoolers draw line graphs. In this math instructional activity, students interpret minimum wage data and graph the data in a line graph. High schoolers predict the next minimum wage and figure the earnings for a 40 hour work week...
Curated OER
Statistics: Reading and interpreting production graphs
Students interpret and create different types of graphs. They analyze data from charts, develop a survey and design appropriate graphic illustrations and make a presentation.
Curated OER
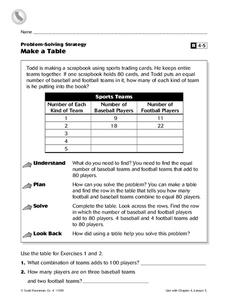
Make a Table
In this charting worksheet, 4th graders complete a table. Using the information provided, students fill in the missing data and complete 2 short answer questions.
Curated OER
Completing frequency diagrams from displayed data
In this frequency worksheet, students use data in graphs and charts to complete a frequency diagram. Students fill in 26 spaces in the diagram.
Curated OER
Graphs Galore
Fourth graders conduct surveys to collect data. They analyze and interpret the data, then determine which type of graph is appropriate for the data. Students use the data to make predictions, discover patterns and draw conclusions...
Curated OER
A Nation of Nations Lesson Plan: Charting African Ethnicities in America
Students read a portion of the narrative, The Transatlantic Slave Trade, to explain the ethnic origins of enslaved Africans brought to the US. They create charts and bar graphs comparing ethnicities in the lowlands and tidewater regions.
Curated OER
Chart problems involving car defects and customer service departments
In this interactive worksheet, students solve two problems using the charts provided. Students must convey they are able to understand charts and how to read them.
Curated OER
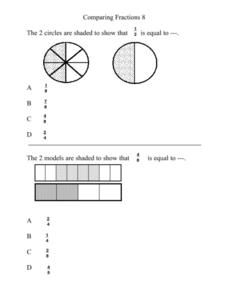
Comparing Fractions 8
In this elementary math worksheet, 5th graders compare fractions using a pie chart and practice finding the values in the multiple choice format.
Curated OER
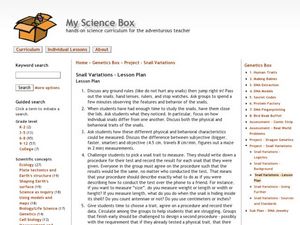
My Science Box
Students investigate snails and their physical and behavioral characteristics. In this investigative instructional activity students create a pie chart to show the results of their findings.
Curated OER
Diagnosing Allergies Through Data Collection
Students research and organize information about allergies. In this data collection lesson, students watch a video about allergies. Students create a histogram using the information collected. Students complete the 'Displaying Survey...
Curated OER
Types of Data
In this data chart learning exercise, learners read the directions and study the examples to learn the difference between qualitative, quantitative, discrete and continuous data. Students answer 24 questions. This page is intended to be...
Curated OER
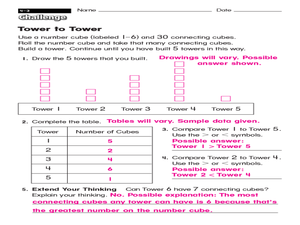
Building Towers with Number Cubes
In this building towers with number cubes worksheet, 2nd graders build number cube towers by rolling a dice, then complete a data chart to compare the number of cubes in each tower.
Curated OER
Part of a Whole Group One
In this fractions worksheet, students solve word problems where they solve problems about parts of whole groups using pictures, charts, and more. Students complete 4 problems.
Curated OER
Make a Tally
In this tally chart worksheet, students read the word problems and use the information within the problem to make a tally chart. Students use the tally charts to help them finish and solve the word problem.
Curated OER
Meatiest States: Graph Problem Solving
In this graph problem solving instructional activity, students analyze a graph that shows commercial red meat production in five states. Students answer 5 word problems using the data on the graph.
Curated OER
Plotting Wind Speed and Altitude
Students construct, read and interpret tables, charts and graphs. They draw inferences and develop convincing arguments that are based on data analysis. They create a graph displaying altitude versus wind speed.
Columbus City Schools
What is Up Th-air? — Atmosphere
Air, air, everywhere, but what's in it, and what makes Earth's air so unique and special? Journey through the layers above us to uncover our atmosphere's composition and how it works to make life possible below. Pupils conduct...
Virginia Department of Education
Functions 1
Scholars learn what it means for a relation to be a function and see various representations of functions. After learning the definition, they participate in a card sorting activity classifying relations as functions or not.
Curated OER
Which Car Should I Buy?
Young scholars use gas mileage of different cars to create T charts, algebraic equations, and graphs to show which gets better mileage. In this gas mileage lesson plan, students use the graph to see which car they should buy.
Curated OER
Are We Couch Potatoes or Busy Bees? Data Analysis of Physical Activity in School
Learners study practical data analysis within the constraints of the scientific method. In this data activity students collect and enter data into a computer spreadsheet then create graphs.
Curated OER
Poetic Math Greeting Cards
Fourth graders work in groups; collect data in a survey; depict in tables, charts, or graphs the results of the survey; and make predictions. They use creative writing skills and computer skills to generate a greeting card of their own.
Curated OER
Higher Order Thinking (H.O.T.) Lesson - BIG E
Fourth graders work with patterns while using large numbers. In this patterning lesson, 4th graders go over the definitions of the words: predict, estimate, attendance, increase, and decrease. They complete worksheets in which they track...
Curated OER
Connecticut Wildlife: Biodiversity and Conservation Status of Our Vertebrate Populations
Students explore the different types of vertebrates found in their area. In this environmental science lesson, students perform a case study on the Common Raven. They analyze data collected from research and create charts and graphs.
Other popular searches
- Pie Charts and Graphs
- Reading Charts and Graphs
- Behavior Charts and Graphs
- Charts and Graphs Candy
- Interpret Charts and Graphs
- Charts and Graphs Christmas
- Charts and Graphs Math
- Analyzing Charts and Graphs
- Tables, Charts and Graphs
- Charts and Graphs Europe
- Using Charts and Graphs
- Bar Graphs and Charts


