Curated OER
Using My Nasa Data To Determine Volcanic Activity
Students use NASA satellite data of optical depth as a tool to determine volcanic activity on Reunion Island during 2000-2001. They access the data and utilize Excel to create a graph that has optical depth as a function of time for the...
Curated OER
Relative Dating - Telling Time Using Fossils
Students use fossil range charts to explain relative dating. They graph for ammonites, marine organisms that went extinct at the same time as dinosaurs.
Curated OER
Scientific Observation of Force and Acceleration on an Object
In this force and acceleration worksheet, 8th graders answer ten questions based on two graphs. The first graph is a scatter plot, the second is a line graph.
Curated OER
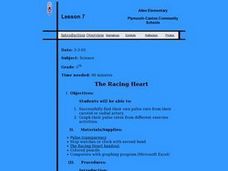
The Racing Heart
Fifth graders locate their own pulse rate from their carotid or radial artery, and graph their pulse rates after completing various exercise activities. They graph their data on a pie graph using Microsoft Excel software.
Curated OER
Weather Report Chart
Young scholars complete a weather report chart after studying weather patterns for a period of time. In this weather report lesson plan, students measure temperature, precipitation, cloud cover, wind speed, and wind direction for a...
Curated OER
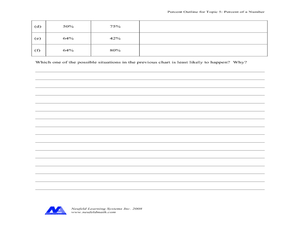
Percent of a Number
In this percent worksheet, students complete problems such as changing percents to decimals, filling in percentage charts, and more. Students complete 8 problems.
Curated OER
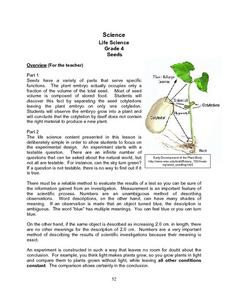
Life Science - Seeds
Fourth graders participate in a scientific experiment involving growing lima beans. Students plot information gathered on included charts and graphs. Students use the steps of the scientific method throughout this experiment.
Curated OER
Math: Football Fever Fun
Students compile statistics from high school or other football team and construct a spreadsheet on which to record their findings. Using Chart Wizard to analyze the data, they construct charts and graphs for a visual display of the...
Curated OER
Best Practices
Students are encouraged to do their best on the mile run portion of the fitness test. They also gain knowledge about fitness in other academic areas of the school too. In science, the class records resting pulse rates, in math, charts...
Curated OER
Sunshine Math 1
In this cumulative math review instructional activity, 2nd graders respond to a variety of review questions which can be used for practice testing. Students answer 6 questions pertaining to charts and graphs, word problems, and patterning.
Curated OER
Sunshine Math 5
In this cumulative math review worksheet, students respond to a variety of review questions which can be used for practice testing. Students answer 9 questions pertaining to charts and graphs, word problems, and fractions.
Curated OER
Sunshine Math 5
For this cumulative math review worksheet, 5th graders respond to a variety of review questions which can be used for practice testing. Students answer 8 questions pertaining to charts and graphs, word problems, and equations.
Curated OER
Sunshine Math 4
In this cumulative math review worksheet, students respond to a variety of review questions which can be used for practice testing. Students answer 9 questions pertaining to charts and graphs, word problems, measurement, fractions, and...
Curated OER
Countdown to Disaster
Students discover the potential dangers of weather in their hometown. In this environmental lesson, students research Hurricane Hugo and the devastation it caused South Carolina in 1989. Students record weather data from their city and...
Curated OER
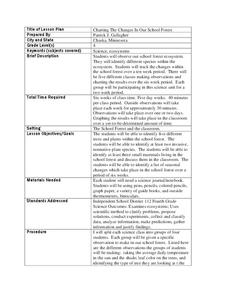
Charting the Changes in Our School Forest
Fourth graders investigate the ecosystem and how forests are disappearing. In this environmental protection lesson, 4th graders analyze the changes in their school for 2 weeks. Students practice identifying trees, birds, and foliage...
Curated OER
Swimmy's Friends
Students solve problems using various strategies. For this problem solving lesson, students read the book Swimmy by Leo Lionni. Students make fish swimming patterns, measure how many goldfish crackers it takes to make a handprint and...
Curated OER
Bird and Breakfast
Students examine winter birds. In this KWL chart lesson, students fill out the chart and view a PowerPoint presentation. Students then complete the chart and discuss winter birds.
Curated OER
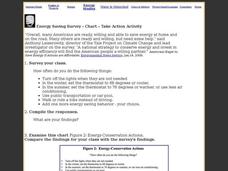
Energy Saving Survey - Chart - Take Action Activity
In this saving energy activity, students survey the class about saving energy, examine an energy chart, and answer short answer questions. Students complete 4 tasks.
Curated OER
Pronouns and Nouns
Second graders identify nouns and pronouns from a story. In this nouns and pronouns lesson plan, 2nd graders review the definition of these words. Students then locate nouns and pronouns in the book they are reading. Students list these...
Curated OER
Equal Parts
In this equal parts worksheet, students, working with a partner, study, formulate and calculate the answers to six word problems or drawings.
Curated OER
You Know, Jack
Increase communication skills, especially among your ESL population, with this activity. Get children up and out of their seats asking clarifying questions about their hypothetical friend "Jack." A chart categorizes questions into "last...
Curated OER
Ready for Roots
Fourth graders sort seeds and predict what conditions are needed for them to germinate. They keep the seeds moist, observe and measure their growth and graph the results. As the seeds start to grow students compare and contrast the each...
Curated OER
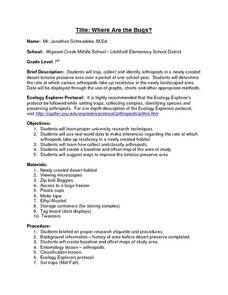
Where Are the Bugs?
Students trap, collect and identify arthropods in a newly created desert tortoise preserve area over a period of one school year. They determine the rate at which various arthropods take up residence in the newly landscaped area. Data is...
Curated OER
Death by Particles
Emerging epidemiologists define relative risk and read an article about the effect of particulate pollution on the cardiovascular health of women. They record the relative risk values, graph them, and answer analysis questions. This is a...
Other popular searches
- Pie Charts and Graphs
- Reading Charts and Graphs
- Behavior Charts and Graphs
- Charts and Graphs Candy
- Interpret Charts and Graphs
- Charts and Graphs Christmas
- Charts and Graphs Math
- Analyzing Charts and Graphs
- Tables, Charts and Graphs
- Charts and Graphs Europe
- Using Charts and Graphs
- Bar Graphs and Charts


