Curated OER
Unit VII: Worksheet 4 - Energy
Energize your physics class with this energy exercise! Physics learners solve seven problems in which they calculate speed, velocity, or energy values for a variety of situations. This is a suitable homework assignment for high school...
Curated OER
Budget Making
After analyzing a pie graph of national spending, high schoolers express their opinions on priorities for national spending. They create a new bar graph and mail it to their congressional representative with recommendations about needed...
Curated OER
Constitution/Impeachment/Reconstruction
Eleventh graders analyze a chart comparing U.S. census data from 1850, 1880, 1900, and 1920. They read a handout summarizing immigration legislation from 1882-1996 and create a graph charting how open / closed U.S. immigration is over time.
Curated OER
Building the Aggregate Expenditures Model
A good accompaniment to an economics lesson, this presentation explores the aggregate expenditures model, detailing the relationship between consumption and saving using graphs and charts. Additional information includes investments and...
Curated OER
Chapter 10: Aggregate Expenditures (The Multiplier, Net Exports, and Government)
Effectively portraying the multiplier effect and the gaps within recession and inflation periods, these slides would be a good resource for both a beginning and advanced economics class. Clear, easy-to-read graphs and charts take viewers...
Curated OER
Chapter 25: Monopolistic Competition and Oligopoly
Poring over the details and characteristics of monopolistic and oligopoly systems, these slides include charts, graphs, and key terms to help viewers truly grasp the concepts behind each market model. From budding economists to...
Curated OER
Chapter 17: Economic Growth and the New Economy
Is economic growth necessary to remain a relevant world power? These slides discuss the definition and implications of growth economics, complete with global comparisons and ways to account for growth. Graphs and charts are easy to read...
ProCon
Israeli - Palestinian Conflict
Many people think the best solution to the Israeli-Palestinian conflict is a two-state solution. After reviewing the available resources, scholars determine whether they agree with that approach. They analyze graphs and charts about...
Curated OER
Ornithology and Real World Science
Double click that mouse because you just found an amazing lesson! This cross-curricular Ornithology lesson incorporates literature, writing, reading informational text, data collection, scientific inquiry, Internet research, art, and...
Curated OER
Virtual Field Trip
This hands-on resource has future trip planners analyze graphs of mileage, gasoline costs, and travel time on different routes. While this was originally designed for a problem-solving exercise using a Michigan map, it could be used as a...
Curated OER
I Wonder How Fast Manduca Grows...
Students create a graph showing the growth of their manduca since it hatched. They make their own predictions about how it will grow. They answer questions to end the lesson plan.
Curated OER
Class Presentation on Coal
Did you know that coal was formed from plants? After being assigned a coal-related topic, groups gather, organize, and present information about this energy source. The presentations should include visuals like graphs, charts, tables,...
Curated OER
The Silk Road, An Ancient Internet
Pupils examine how goods and ideas moved along an ancient trade route between China and Europe. They make charts of items, ideas, etc. that were transported along the Silk Route.
Curated OER
Groovin' News Activity Sheet
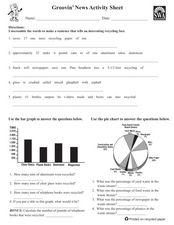
In these recycling worksheets, students complete several activities to learn about recycling. Students complete a word search, word scramble, bar graph, pie chart, research project, class project, and individual project for recycling.
Curated OER
WHAT IS THE POPULAR COLOR?
Fourth graders graph cars according to their colors. They complete the graph including a title, scale, x-axis, and y-axis. Students collect the data and choose the type of graph to be made.
Curated OER
Endangered Species
Ninth graders graph data in order to compare the number of extinct species and a rise in human population. They analyze the data collected. Students are encouraged to infer the relationship.
Curated OER
A Fishy Tale
Eighth graders do a research project on a particular species of Atlantic seafood and record and graph information pertaining to commercial landings of that species of seafood. They use a website and an Appleworks spreadsheet.
Curated OER
Sectionalism in Early U.S.
Students, divided into three groups, representing the Northeastern, Southern, Western United States. They research these areas in early American history and as a group prepare charts, graphs and reports. They explain their needs and...
Curated OER
"Data Dabble"
Students engage in a lesson plan which facilitates their use of web sites to find data, graph it, and interpret it, thus scaffolding graphing skills to prepare students for their 8th grade I-search exit project.
Curated OER
Sink It
Introduce your class to the concept of sinking and floating. In groups, they classify objects after making predictions about which materials will sink or float. They record their results and create graphs and charts to share with the class.
Curated OER
Old Glory
Learners utilize mathematical concepts such as: measurement, ratio and proportion and geometric probability to analyze the components of the U.S. Flag. They collect, organize and interpret data by constructing charts, tables and graphs...
Curated OER
Shadows and Skyscrapers
Eighth graders explain the relationship between the position of the sun, a city's latitude and shadow length. Ratio's, geometry, and algebra are used to determine the shadow lengths and building heights. A sun angle (altitude) charts to...
Curated OER
Maximize It!
Students design a rectangular box without a lid that has the largest possible volume using the supplied sheet of centimeter graph paper. They work in groups to construct different size boxes to determine the largest possible volume and...
Curated OER
Exploring Exponential Growth and Decay Functions
Pupils differentiate between exponential growth and decay. In this algebra lesson, students solve exponential equations using properties of exponents. They use the Ti calculator to graph and analyze their functions.
Other popular searches
- Pie Charts and Graphs
- Reading Charts and Graphs
- Behavior Charts and Graphs
- Charts and Graphs Candy
- Interpret Charts and Graphs
- Charts and Graphs Christmas
- Charts and Graphs Math
- Analyzing Charts and Graphs
- Tables, Charts and Graphs
- Charts and Graphs Europe
- Using Charts and Graphs
- Bar Graphs and Charts


