Curated OER
How's the Weather?
Students explore earth science by researching the Internet. In this weather pattern lesson plan, students utilize the website weather.com to analyze the weather in different geographic locations. Students view charts and graphs based on...
Curated OER
Santa's List Sums
In this Christmas math worksheet, students help Santa find the number of children on each street by adding the sum of boys and girls listed in the chart. Students solve 17 problems.
Curated OER
Santa's List Sums (12)
In this Christmas math worksheet, students help Santa find the number of children on the 17 streets by adding the number of boys and girls in each line of the chart.
Curated OER
Good Health Care
Students work in collaborative groups researching topics such as nutrition, the benefits of exercise on the body, dental and personal hygiene. They conduct interviews, create charts and posters, and report their results with a written...
Curated OER
Lesson 3: Seven Day Road Trip
Students plan a seven day road trip. In this travel lesson, students plan a driving trip that includes five major cities or attractions in Florida or another state of their choice. They show the trip on a map, calculate distances that...
Curated OER
Jelly Bean's Galore
Young scholars investigate the origins of the Jelly Bean. They complete a Scavenger Hunt using the jellybean website. Pupils create a bar graph using information collected about jelly beans. Students discuss the time of year that Jelly...
Alabama Learning Exchange
The Grouchy Ladybug
Students listen to the book, "The Grouchy Ladybug" by Eric Carle and sequence the events in the story. Using a graph, they draw and color the animals that the ladybug meets next to the corresponding time from the story, and conduct...
Curated OER
Black History Project
Third graders explore and analyze about famous African-Americans by listening to four picture book biographies. They generate a list of 15 famous African-Americans and then create a survey to rank them according to importance of...
Curated OER
Yummy Apples!
Students discuss apples and how they are grown. They listen as the teacher reads "Apples," by Gail Gibbons. Students discuss the story. They view several different types of apples and compare their characteristics. Students taste several...
Curated OER
T-Shirt Lettering
Learners determine the cost of a t-shirt using a variety of mathematical operations to solve problems. Then they use a spreadsheet to calculate the cost of lettering a t-shirt and display this information in a graph.
Curated OER
Technology Blackout Day
Students describe the impact of modern technology inventions on daily life. They create a graph of the class's favorite item of technology and draw a picture of their favorite piece of modern technology.
Curated OER
The Perfect Principal
Students demonstrate their understanding of math skills. In this data analysis lesson, students complete a worksheet requiring them to calculate mean, median, and mode, and create and interpret graphs. Lesson is intended as an assessment...
Curated OER
Too Free, Or Not Too Free?
Students create a survey that examines what level of electronic surveillance might be acceptable to members of the school and community. They poll the community, and analyze the results in the form of graphs and a written news article.
Curated OER
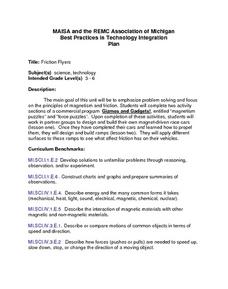
Friction Flyers
Learners explore the principles of magnetism and friction. They complete an interactive puzzle on the Gizmos and Gadgets computer software, construct a vehicle, build and modify ramps and vehicles to produce various outcomes, and...
Curated OER
Let's Brush Our Teeth!
Students complete a variety of activities related to types of teeth and how to take care of their teeth. They listen to the book "The Real Tooth Fairy," count and graph how many teeth they have and how many they have lost. Students...
Curated OER
Microsoft Office Excel
Pupils use Microsoft Office Excel. In this technology activity, students enter data on a spreadsheet using Excel. This programs tallies data and presents it using graphs.
Curated OER
Streamflow
Learners discuss the topic of streamflow and how it occurs. They take measurements and analyze them. They interpret data and create their own charts and graphs.
Curated OER
"Favorite Fairy Tale Characters"
Third graders enter the results of their survey on a spreadsheet. They construct a bar graph showing the results.
Curated OER
Data Shuffle
Middle schoolers find an advertisement or newspaper using charts or graphs. They create another graph using the same information in a different format. They write a comparison of the two graphs.
Curated OER
Finding the Flu
Students work to determine when the flu is most prevalent in the United States. They gather data on their own, create calendar, charts, and graphs, analyze their findings and present them. This is a very appropriate winter lesson!
Curated OER
My Favorite Birthday
Learners collect and organize data from classmates, display data on simple chart, and plan class birthday party.
Curated OER
Using A Table
In this table activity, learners observe information in a table, and then answer ten questions pertaining to the information. They must correctly read a table in order to arrive at the correct answer. Questions pertain to features of a...
Curated OER
Temperature
In this temperature worksheet, students color a thermometer to depict the given temperature. They then compare, contrast temperatures and answer given thinking questions. There are approximately 20 questions on this one-page worksheet....
Curated OER
Charting Mold Growth
Students chart mold growth based on food supply. For this mold growth lesson plan, students chart micro-organism growth and the decline of the growth as food runs out.
Other popular searches
- Pie Charts and Graphs
- Reading Charts and Graphs
- Behavior Charts and Graphs
- Charts and Graphs Candy
- Interpret Charts and Graphs
- Charts and Graphs Christmas
- Charts and Graphs Math
- Analyzing Charts and Graphs
- Tables, Charts and Graphs
- Charts and Graphs Europe
- Using Charts and Graphs
- Bar Graphs and Charts


