Curated OER
Making a Spreadsheet
Students explore spreadsheet software. In this personal finance and computer technology lesson, students develop a vacation spreadsheet on the computer. Students represent hotel, food, transportation, and entertainment costs on a graph...
Curated OER
Leap Frog Experiment
Second graders ask questions and design an experiment to explore different spinners in "The Leap Frog" board game. They conduct their experiment, collect information and interpret the results using a graph.
Curated OER
The Cultural Geography of Australia, Oceania, and Antarctica
Students use information from the Australian Department of Immigration and Multicultural Affairs Web site to explore multiculturalism and immigration in Australia. They create graphs and charts from immigration data.
Curated OER
Harry Potter Research Project
Young scholars work together to complete a research project on Harry Potter. They write a research question and develop a survey to give to their classmates. Using the results, they create a graph and draw conclusions about the data...
Curated OER
Putting Your Best Foot Forward
Third graders measure their feet and their parents' feet, record data on computer-generated graphs, and calculate and record mean, median, and mode.
Curated OER
Curiosity Does Not Kill The Cat
Students list the different ways they could test a guinea pig, a dandelion, and their brother (or sister)? They create a data chart in their group that lists the organism, what they could measure, and how they could change that measurement.
Curated OER
Picnic Possibilities
Fourth graders plan a picnic using weather data. Using accumulated weather data from various sources, they create a graph of the weather conditions in their region for a given period of time. Students interpret this data to predict the...
Curated OER
Business Lesson Describing Trends
Students practice their skills using business English. After a lecture/demo, students interpret economic graphs which are imbedded in this lesson. Then, they create their own graphs and describe them to the class.
Curated OER
Education for Global Peace
Students survey the class and graph the results. In this graphing and data collection lesson, students conduct a survey to see where their shirts were produced. Individuals use software to graph the results and create a written...
Curated OER
The Greenhouse Effect
Seventh graders investigate the temperature change in open and closed containers. In this earth science instructional activity, 7th graders relate this lab activity to greenhouse effect. They create a line graph from data collected in...
Curated OER
There Is A Lady In The Room
Students use magnifiers to observe the characteristics of ladybugs. From recorded observations and gathered data, they construct patterns and graphs of their favorite ladybugs. Children listen to a book on The Grouchy Ladybug and...
Curated OER
Lesson Six: Nonfiction Text Elements (Part One)
Students examine nonfiction text elements in preparation for writing a nonfiction book about Lewis and Clark. In this social studies/language arts instructional activity, students discuss the term research and complete a cluster map....
Curated OER
Diabetes - It's a Killer!
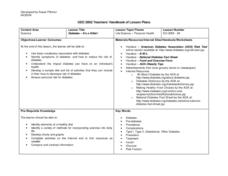
Learners survey, graph and chart their prior knowledge about diabetes. They read a handout and complete a K-W-L chart. They develop a rubric to assess their diet and exercise and develop a shopping list, menu and exercise plan to share.
Curated OER
If You're Under Pressure, Blame It On The Air Force
Students complete an experiment in which they demonstrate that air exerts a force. In groups, they create their own siphon and define air pressure. They estimate the time it might take to siphon various amounts of water. They collect,...
Curated OER
Unit 2: Lesson 7
Students are introduced to spreadsheets. They conduct a survey of television viewing time of different shows based on different age categories. Students work in small groups. They collect, data and interpret the data from a survey.
Curated OER
Groups Coming to America
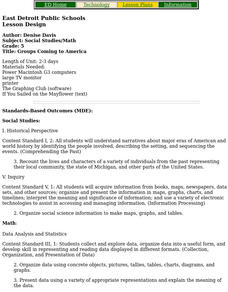
Fifth graders use text or other references to locate different types of information about the Mayflower and pilgrims. They create a presentation for lower elementary classes about the Pilgrims.
Curated OER
Comuter Technology-Applying Spreadsheet Information
Students create spreadsheets and practice sorting within the spreadsheet with three different activities. Students manipulate different materials such as addresses, real estate sales, and athletic participation numbers.
Curated OER
Relative Dating-Telling Time Using Fossils
Students explore how to read fossil range charts. They develop an knowledge of the strengths and weaknesses of the fossil record. Students become familiar with the concepts index fossil and fossil range. Students use bar graphs to...
Curated OER
The Built Environment-An Integrating Theme
Students observe, record, and present knowledge of their local built environment while conducting a walking tour of their community. They develop written and photo journals, drawings, time lines, graphs, and charts to engage in...
Curated OER
How Do We Use Scientific Inquiry To Solve the World's Problems?
Ninth graders examine how a scientific investigation is performed. They read and discuss examples of various scientific experiments, design an experiment involving fast growing plants, and create graphs and charts to present their...
Curated OER
A Child's Journey through Medicine
Students experience a variety of activities that relate to human physiology and their functions. They create graphs and charts after testing their heart rates and blood pressure They conduct a survey of the student body and create ...
Curated OER
We Are Lunar tics!
Second graders, working in cooperative groups, will create a multimedia presentation about the Earth's moon. Their research must be presented through three or more methods. (i.e. charts; graphs; oral reports; multi-media; dramatic role...
Curated OER
The Muckrakers Interdisciplinary Unit
Eighth graders complete an Interdisciplinary Unit on the Muckrakers and the Progressive Movement. Students describe life in America and how Progressive Reformers changed it. identify specific problems and propose solutions. Students...
Curated OER
Jelly Bean Egg Challenge
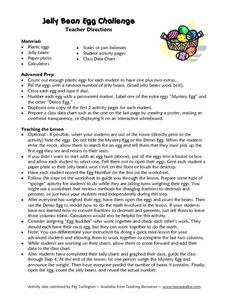
Young scholars each receive a plastic egg filled with jelly beans. In this Jelly Bean Egg Challenge, students estimate and weight their eggs, they count the number of jelly beans inside their egg, they chart their data and compare their...
Other popular searches
- Pie Charts and Graphs
- Reading Charts and Graphs
- Behavior Charts and Graphs
- Charts and Graphs Candy
- Interpret Charts and Graphs
- Charts and Graphs Christmas
- Charts and Graphs Math
- Analyzing Charts and Graphs
- Tables, Charts and Graphs
- Charts and Graphs Europe
- Using Charts and Graphs
- Bar Graphs and Charts


