Curated OER
M&M Caper
Students participate in a game with M&M's to be introduced to percents and ratios. Individually, they estimate and record the number of candies they believe the bag holds and the amount of each colored candy. They open the bag and...
Curated OER
Take Me Out To the Ball Game
Students use a map to graph and locate major league teams of different sports. In groups, they analyze the population data of the United States and compare it with the amount and location of the major league teams. They share their...
Curated OER
Energy Costs of Walking and Running
In this energy worksheet, students use a data chart comparing the energy used while running and walking to create a graph and complete 2 short answer questions.
Curated OER
Budgeting (Part 1)
Students examine why a budget may be helpful. In this budgeting lesson plan, students graph how they spent money during the past week. They discuss the benefits of creating a budget and explore the difference between wants and needs.
Curated OER
Linking Real World Data to the Classroom
Students analyze data representing real life scenarios.In this algebra lesson, students collect, plot and analyze data using a graph. They use different methods to represent and present their data.
Curated OER
Squares and Cubes
Middle schoolers recognize, analyze, and use square color tiles and interlocking cubes to discover patterns in perimeter, area, and volume. They will then chart and graph their results.
Curated OER
Fast Food: You Can Choose!
Learners research the nutritional value of fast food. They assess which fast foods are best and worst to eat. They organize their data into tables and graphs and explain their findings to other students.
Curated OER
Supermarket Smarts
Pupils examine how a consumer can make informed choices. They visit stores with a prepared shopping list, record the prices on a spreadsheet, create graphs, and create a Powerpoint presentation comparing the total cost of stores and a...
Curated OER
Using Radiosonde Data From a Weather Balloon Launch
Student use radiosonde data from a weather balloon launch to distinguish the characteristics of the lower atmosphere. They learn the layers of the atmosphere. They graph real atmospheric data.
Curated OER
Discovering the Problem of Solid Waste
Learners catagorize the types of garbage from going through a trash can provided by their teacher. They then chart the items on a graph and propose a solution to reduce the amount of garbage.
Curated OER
Cold Enough?
Students read and record temperatures and display the data. They represent the temperatures on an appropriate graph and explain completely what was done and why it was done. Students display the data showing differences in the daily...
Curated OER
Data Collection and Presentation
Students concentrate on discrete quantiative data. They are shown that the vertical line diagram as a more appropriate way to present discrete quantiative data then bar charts. Students work as a group to help with the interpretation...
Curated OER
Trouble in the Troposphere
Students Use data sets from MY NASA DATA to produce graphs comparing monthly and yearly ozone averages of several U.S. cities. They analyze and evaluate the data and predict trends based on the data. In addition, they discuss and...
Curated OER
Natural Resources
Fifth graders begin the lesson by identifying the different types of natural resources. As a class, they discuss how environments are destructed and how the loss of one natural resource can affect the economy. Using a map, they label the...
Curated OER
Evaluating Data
In this data worksheet, students learn how to organize the data collected during an experiment and practice finding patterns. Students graph a table of experimental data and complete 1 short answer question.
Curated OER
Analyzing Health
Third graders analyze their health. In this analysis lesson plan, 3rd graders rate their health on a 1-10 scale. They then tally the scores from the class and create a data chart. Then they answer true and false questions based on...
Curated OER
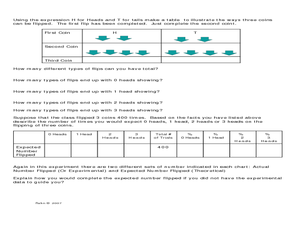
Let's Flip a Coin
In this probability instructional activity, learners use a TI graphing calculator to simulate flipping a coin and compare their results (experimental probability) to the expected results (theoretical probability). The five page...
Curated OER
Linear Functions
Students solve and graph linear equations. In this algebra instructional activity, students collect data and plot it to create a linear function. They identify the domain and range of each line.
Curated OER
No New Workers Need Apply
Students explore older people's perspectives on work and retirement by creating charts to reflect statistical trends and formulate interview questions. They write follow-up articles that record and comment on the attitudes of their...
Curated OER
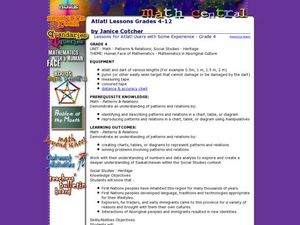
Atlatl Lessons for Grade 4
Fourth graders explore the weapons of the Aboriginal people. In this fourth grade math lesson, 4th graders create charts, tables, or diagrams to represent patterns and relations. Students investigate which dart length has the best...
Curated OER
Trouble in the Troposphere
Students create graphs using NASA data, compare ozone levels of several U.S. cities, analyze and evaluate the data and predict trends based on the data, and discuss and describe how human activities have modified Earth's air quality.
Curated OER
From Sea to Shining Sea
Students study the geography of the United States of America. Students write letters, create travel brochures, make maps, graph population numbers, read fiction and nonfiction selections, complete KWL charts, and watch films.
Curated OER
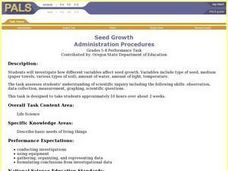
Seed Growth
Students develop an independent procedure to investigate the germination of two types of seeds. Students must construct data tables or charts to record observations and results, graph the data, and analyze the data.
Curated OER
Solar Energy - Dehydration
Sixth graders explore process of drying food using solar energy. They cook and/or dry food such as pumpkins, watermelon, corn, and deer meat, explain how solar energy changes foods, and compare and contrast solar energy with other forms...
Other popular searches
- Pie Charts and Graphs
- Reading Charts and Graphs
- Behavior Charts and Graphs
- Charts and Graphs Candy
- Interpret Charts and Graphs
- Charts and Graphs Christmas
- Charts and Graphs Math
- Analyzing Charts and Graphs
- Tables, Charts and Graphs
- Charts and Graphs Europe
- Using Charts and Graphs
- Bar Graphs and Charts


