Curated OER
Measuring Soil Temperatures at South Penquite Farm
Learners investigate soil temperatures. In this graphing and earth science lesson, students insert temperature probes into different types of soil at varying depths. Learners complete a data chart and construct a related graph...
Curated OER
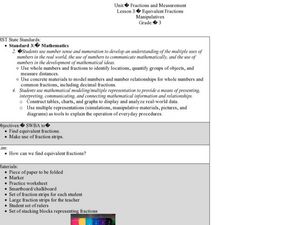
Equivalent Fractions Manipulatives
Students study fractions. In this equivalent fractions lesson, students utilize fraction strips to enhance their understanding of equivalent fractions. They watch a demonstration and then work independently with their own set of fraction...
Curated OER
Volume, Mass, and Weight
Study the difference between mass and weight. Your math group will compare the weight of an item to the amount of space that it uses. They'll then use conversion factors to find the difference between kilograms and pounds. Essential...
Curated OER
Positive Future Fair Project
Ninth graders view the film "Pay It Forward" and discuss what kind of public campaign is needed to move people to positive action. They consider different ways of presenting information (graphs, visual displays, etc.) as tools for...
Curated OER
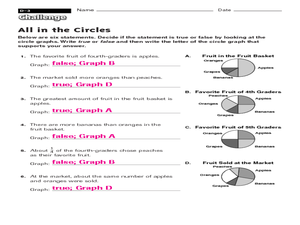
All in the Circles
In this circles worksheet, learners use 4 circle/pie chart graphs to answer a set of 6 questions. Answers are included on page 2.
Curated OER
M&M Caper
Students participate in a game with M&M's to be introduced to percents and ratios. Individually, they estimate and record the number of candies they believe the bag holds and the amount of each colored candy. They open the bag and...
Curated OER
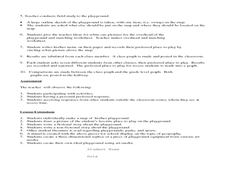
Where Oh Where on the Playground, Do I Love To Be?
Students listen to poem, Where Oh Where On the Playground, Do I Love to Be?, and practice reading, interpreting, and making maps, charts, and graphs in surveying classmates and discussing their favorite places to play in school playground.
Curated OER
An Encyclo-ME-dia for Every Child
Students create a digital scrapbook that shows information-text and pictures that are specific to each child. They make charts and graphs. They use digital cameras, scanners, software, to write captions, stories, poems, letters, and...
Curated OER
Cold Enough?
Students read and record temperatures and display the data. They represent the temperatures on an appropriate graph and explain completely what was done and why it was done. Students display the data showing differences in the daily...
Curated OER
Handling Data: Comparing Distributions
Young scholars gather information by analyzing graphs, diagrams and pie charts. In this graphs and diagrams lesson, students complete addition and subtraction problems. Young scholars discuss a pie chart. Students use information to...
Curated OER
Cindy and Linda - Selling Lemonade
In this pie charts worksheet, learners use the pie chart to count how many glasses of Lemonade were sold by Cindy and Linda. Students complete the table and answer 3 questions.
Curated OER
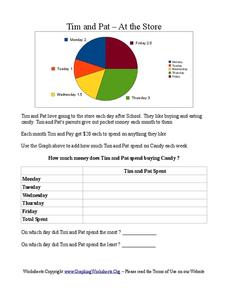
Tim and Pat - At the Store
In this pie chart activity, students use the pie chart to add the amount of time Tim and Pat spend buying candy each day of the week. Students answer 2 questions about the table.
Curated OER
Let's Go Shopping
In this fraction and pie chart worksheet, students draw a line from the toys with the prices of 50 cents, 75 cents, and 25 cents to the pie chart that show the part of a dollar the toy costs.
Curated OER
Data Shuffle
Middle schoolers find an advertisement or newspaper using charts or graphs. They create another graph using the same information in a different format. They write a comparison of the two graphs.
Curated OER
Finding the Flu
Students work to determine when the flu is most prevalent in the United States. They gather data on their own, create calendar, charts, and graphs, analyze their findings and present them. This is a very appropriate winter lesson!
Curated OER
Mathematics: Best Salary
Sixth graders pretend to need jobs to earn money for a go-cart which costs $1,000. They predict which of two scenarios raise the money first. they construct charts and graphs to demonstrate their predictions.
Curated OER
One, Two, Three...and They're Off
Students make origami frogs to race. After the race they measure the distance raced, collect the data, enter it into a chart. They then find the mean, median, and mode of the data. Next, students enter this data into Excel at which time...
Curated OER
Swimmy's Friends
Students solve problems using various strategies. For this problem solving lesson, students read the book Swimmy by Leo Lionni. Students make fish swimming patterns, measure how many goldfish crackers it takes to make a handprint and...
Curated OER
Law of Large Numbers - Hospital
Students explore concepts of probability and independent events. They develop a formula for deviation percentage.
Curated OER
Plastic Packaging
Students collect data. In this math instructional activity, students collect data about recyclable materials. Students develop a plan that will help the environment. Recycling plastic containers is discussed.
Curated OER
Candy Bar Survey
Second graders investigate the skill of graphing data by using candy bars to create context for the lesson. They use technology for graphing and organizing information like a spreadsheet. The lesson includes a resource link to aid in the...
Curated OER
Education for Global Peace
Fifth graders construct data graphs based upon sets of data. In this graphing instructional activity, 5th graders read the text If the World Were a Village and discuss how types of graphs accurately represent a large population. Students...
Curated OER
Making a Spreadsheet
Students explore spreadsheet software. In this personal finance and computer technology lesson, students develop a vacation spreadsheet on the computer. Students represent hotel, food, transportation, and entertainment costs on a graph...
Curated OER
Harry Potter Research Project
Young scholars work together to complete a research project on Harry Potter. They write a research question and develop a survey to give to their classmates. Using the results, they create a graph and draw conclusions about the data...


