Federal Reserve Bank
Lesson 4: Back to School
Based on your current level of human capital, how long would it take you to earn $1,000,000? What about your potential human capital? Learners explore the importance of education and experience when entering the workforce, and compare...
Curated OER
Getting Into Shapes: Identifying and Describing Two-Dimensional Shapes
Young scholars examine their classroom to find examples of various types of shapes. After identifying and describing the various shapes, they draw as many as they can on a piece of paper. They organize them into an image based on their...
Curated OER
Cartogram of the Great Compromise
Students create cartograms of populations during 1790.
Curated OER
Telling Time to 5 Minutes
In this second grade lesson your class will practice telling time. The goal is to tell time to five minutes using an analog clock. Your young students count by 5 minute intervals and discuss elapsed time.
Curated OER
Data Analysis
Students double check their data collections of Top 20 singles that they've been collecting for several days. Types of data is reviewed in detail and a variety of questions are asked for retention factors of mastery. They draw a tally...
Curated OER
Integrated Algebra
In this integrated algebra worksheet, students solve problems covering topics studied during the year. Problems include topics such as slope-intercept, Venn Diagrams, finding the solution to multi-step algebra problems, writing...
Curated OER
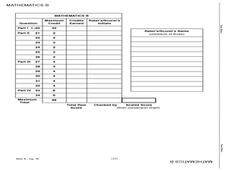
Mathematics B: High School Exam
In this mathematics worksheet, learners solve problems about numerous high school topics including trigonometry, algebra, and pre-calculus. This worksheet contains, but is not limited to, radicals, inverse functions, transformations, and...
Curated OER
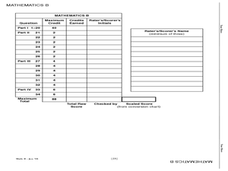
High School Examination: Mathematics B
In this high school examination worksheet, 12th graders solve problems dealing with parabolas, coordinates, probability, dialations, intervals, and trignomeric ratios. This worksheet is designed as a end of course examination. This...
Curated OER
Magnets and Interactions
Second graders discover what magnets can do. In this magnet instructional activity students make predictions about magnets. They experiment with the magnets and record their data on a chart.
Curated OER
Exercise Those Statistics!
Students participate in various activities, measuring their pulse rates and recording the data. They analyze the statistical concepts of mean, median, mode, and histograms using the data from the cardiovascular activities.
Curated OER
Mathematics In You
Learners construct ratios using the hand as data. They use examples of cortical and trabecular bone found in the long bones to measure circumference, diameter, length, and weight of long bones. They perform computations using growth...
Curated OER
Number Stories
Pupils write and solve various number stories. They solve number stories using one, two and three digit numbers. Students practice writing sentences using the following 6+1 traits, ideas and content, organization, word choice and...
Curated OER
Stock It To Me
Young scholars investigate the stock market using stock market tables, charts, and graphs. They participate in a simulation of stock market investment over time. They read about the history of Wall Street and the Stock Market.
Curated OER
Pond Theme Unit
For this pond theme worksheet students research facts on pond life. Students complete comprehension questions, crosswords, word search, and math puzzles. Students write a short report.
Curated OER
Technology Blackout Day
Students describe the impact of modern technology inventions on daily life. They create a graph of the class's favorite item of technology and draw a picture of their favorite piece of modern technology.
Curated OER
What Do We Do With A Dirty Bomb?
Students examine composition of dirty bomb and its possible effects on a city, and investigate simulations of such an event; students use computational and problem solving skills to assess damage and prepare report proposing solution to...
Curated OER
Handling Data: Representing Date - Online Version
Here is an online lesson plan on data representation. In it, learners access websites embedded in the plan which lead them through a variety of activities around data representation and statistics. The activities are quite good, and...
Curated OER
Awesome Animals
Students collect data from classmates about their favorite animal. They use the ClarisWorks graphing program to enter data, graph results, and interpret data.
Curated OER
Chart Trivia
Learners practice addition and subtraction problems and answer questions using greater than and less than. They chart information to create a graph on the computer.
Curated OER
An Apple A Day
Learners create a graph that showcases their pick for favorite kind of apple. Students are given samples of a variety of apples to determine their favorite in a taste test. They a create a tally chart of favorite kinds apples and use a...
Curated OER
"Favorite Fairy Tale Characters"
Third graders enter the results of their survey on a spreadsheet. They construct a bar graph showing the results.
Curated OER
Go Yankees!
Students use the internet to research the New York Yankees baseball team. After gathering their information, they discuss the challenges faced by the team and how they were overcome. They end the lesson by examining the math and...
Curated OER
Ya' Gotta Have Heart
Fourth graders study the parts of the human circulatory system and how they function. They design a flow chart of the circulatory system and use data to construct charts and graphs.
Curated OER
Meter Reading Using Place Value
Fourth graders watch a video about reading a gas meter and discuss what they saw in the clip. In this place value lesson, 4th graders complete a worksheet where they fill in the missing dials on the meters.


