Curated OER
Math Lesson: What Do You Want to Know? - Country Statistics
Students are able to identify the characteristics of a variety of graphs (i.e. bar graph, line graph, pie graph, scatter plot, population pyramids, etc.) They recognize how the type of data to be presented plays a role in choosing the...
Curated OER
Basic Algebra and Computers: Spreadsheets, Charts, and Simple Line Graphs
Students, while in the computer lab, assess how to use Microsoft Excel as a "graphing calculator." They view visual representations of line graphs in a Cartesian plane while incorporating basic skills for using Excel productively.
Curated OER
Usage and Interpretation of Graphs
Students explore graphing. In this graphing lesson, students predict how many shoe eyelets are present in the classroom. Students count eyelets and work in groups to organize and chart the data collected. Students put all the data...
Curated OER
Counting
First graders explore collecting data. They collect data using a data collection sheet and enter the data into Excel. Students create graphs using Excel. They share their graphs with the class.
Curated OER
Games on Echolocation
Get a little batty with life science! This fun simulation game replicates how bats use echolocation to hunt moths in their native Hawaiian habitat. After creating blind folds and discussing some basic principles of echolocation, students...
Curated OER
Graphing Data
Seventh graders solve and graph 10 different problems that include various questions related to data on a graph. First, they create bar graphs to display the data given. Then, pupils determine the random sample of a population listing...
Math Worksheets Land
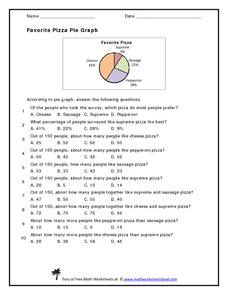
Favorite Pizza Pie Graph
You've heard of a pie graph, but what about a pizza pie graph? Challenge young mathematicians to answer ten questions based on a random survey of people's favorite pizzas. A pie graph displays the percentages of each type of pizza. Some...
Curated OER
Many Ways to Represent Our Data
Demonstrate several ways to represent data with your class. They will use surveys to gather data and display the data using tally charts and graphs. Then answer questions according to the data.
Curated OER
Fruit Loop Graphing
Fifth graders interpret data and create graphs. Given Fruit Loops, they sort and classify according to color. Using spreadsheet technology, 5th graders record their data and create bar and circle graphs. Students analyze data and...
Curated OER
Graphs Review
Seventh graders review different types of graphs such as bar graphs, line graphs, box & whisker plots. As a class, they read a story and construct graphs to solve the data in the story. Students play "Graph Jeopardy" which requires...
Curated OER
Holiday Greeting Cards: A Graphing Activity
Students examine statistics about the popular type of greeting cards and create pie or bar chart using an online tool. They illustrate the sales statistics for the greeting cards before making the charts.
Curated OER
Graphing It Daily
Students identify and demonstrate a positive learning attitude and use basic concepts and skills. Learners also communicate clearly in oral, artistic, written, and nonverbal form. Finally, students participate in the daily data...
Curated OER
Math for Fourth Grade: Statistical Charts
In this math for fourth grade statistical charts activity, 4th graders answer 7 multiple choice questions in standardized test format about data, charts and graphs.
Curated OER
Graphs! Graphs! Graphs!
Students practice making charts and graphs from data on spreadsheets. Individually, they create a graph representing the latest information on voter registration. They answer questions and analyze the data to end the lesson.
Curated OER
7th Grade Math Circle Graphs
Seventh graders are able to develop (synthesis) pie graphs with the class and on their own. They are told that pie charts are a graphic representation of material that can be given in the form of parts of a whole by using...
Curated OER
Application of Graph Theory
Students investigate different online tutorials as they study graphing. In this graphing lesson, students apply the concept of graphs cross curricular and use it to make predictions. They define the purpose and theories behind graphs.
Curated OER
Making a Circle Graph of a Sample Budget
Students examine a sample budget and categorize the entries as a group. Then in small groups they convert budget category totals to percents and degrees to make a circle graph related to a sample budget.
Curated OER
Graphing With Candy
Students gather information and interpret the results using a tally chart, a table, and a bar graph.
Utah Education Network (UEN)
The Human Line Plot
Learners collect data and use charts and line plots to graph the data. Some excellent worksheets and activities are embedded in this fine lesson plan on line plots.
Curated OER
Use Google Maps to Teach Math
Capture the engagement of young mathematicians with this upper-elementary math instructional activity on measuring time and distance. Using Google Maps, students first measure and compare the distance and time it takes to travel between...
Curated OER
Counting Coins
Second graders identify a quarter, dime, penny, nickel, and dime. They match the coin with it's monetary value, collect data on excel spreadsheet, and create a graph in Excel. Students participate in group activities.
Alabama Learning Exchange
Ice Cream Sundae Survey
Young scholars analyze data through graphs. They will complete a class survey on ice cream sundaes and tally and graph the responses. They then analyze the information from the class graph.
Virginia Department of Education
May I Have Fries with That?
Not all pie graphs are about pies. The class conducts a survey on favorite fast food categories in a lesson on data representation. Pupils use the results to create a circle graph.
Curated OER
Math--Pictures and Bars--Learning About Graphs
What is a graph? What does it tell us? How do you make one? These are all questions that are answered in the included packet. It's a great introduction to graphing for young learners!


