Curated OER
Against all Odds
Tenth graders appreciate the role of probability in understanding everyday situations. They Communicate a summary of financial projections in appropriate reports, tables, and graphs after creating a new game of chance.
Curated OER
Electronic Spreadsheets & Iditarod 2000
Students use the Internet for gathering information for Iditarod race journals. They use a spreadsheet program for entering data and making charts for showing changes in speeds achieved over a period of four weeks in timed writings in...
Curated OER
Chain Across the Hudson
Fourth graders role play as contractors responsible for constructing a chain across the Hudson River. They apply math skills to determine the total weight, number of links, and cost of the project.
Curated OER
Blowing in the Wind
Pupils compare hurricanes and tornadoes. They write a paragraph explaining how to prepare for a storm. Students give an oral report. They use weather facts to practice math skills. Pupils record observations of a storm.
Curated OER
Problem-Solving Strategies in Word Problems
Students examine how to determine which strategy to use to solve word problems. In this word problem strategy lesson, students listen to a lecture on the process of using different strategies to solve math problems. They look at guess...
Curated OER
Working with Frequency Tables
In this Working with Frequency Tables worksheet, students analyze data that is organized in simple frequency charts. They calculate average from data presented in a frequency table, calculate a cumulative score, and identify data that...
Curated OER
Michigan Virtual Field Trip
Students analyze data from a virtual field trip to Michigan. They conduct Internet research on mileage and travel time between cities, calculate and compare fuel costs, and research and calculate lodging, activities, and meal costs.
Curated OER
Small Business
Students simulate owning and running a small business by playing Lemonade Stands. They play the game for three weeks, then work with a partner to produce a Power Point presentation which would be given to a Board of Directors showing...
Curated OER
Cars on the Curve
Second graders, using two dice, participate in a car race game called Cars on the Curve. They predict which car wins the game and records it in their Data Diary.
Curated OER
A Recipe for Air
Learners create a pie graph using M&Ms to demonstrate the composition of air. They label each section of the graph, and list the fractions from largest to smallest.
Curated OER
Analysis of Atmospheric Conditions for a High Mountain Retreat
Students examine the relationship between altitude, atmospheric pressure, temperature and humidity at a particular location. They practice science and math in real world applications. They write reports detailing their scientific...
Curated OER
Shake, Rattle and Roll
Sixth graders explore the causes and effects of earthquakes. They also collect and analyze data in graphs. They also use the Internet to research earthquakes
Curated OER
Dealing with Data in Elementary School
Students follow the scientific method in collecting data. In this following the scientific method in collecting data instructional activity, students develop a question they would like answered such as how many aluminum cans are consumed...
Curated OER
One Size Fits All?
Students describe the differences between an estimate and a guess. They create reasonable estimates based on comparison and activities. Students explain how estimation is helpful in showing the relative size on a scale. They also...
Curated OER
Interest and Credit : Business in the Gold Rush and Business Today
Students differentiate the way interest was in the old days compare to today. In this algebra lesson plan, students analyze credit and interest from their parents' point of view, Biblical point of view and a business point of views.
Curated OER
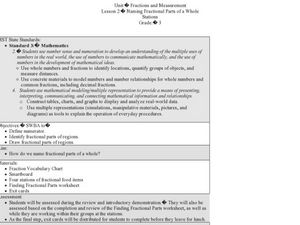
Naming Fractional Parts of a Whole
Third graders complete a worksheet. In this fractions lesson, 3rd graders review fraction vocabulary, use the SmartBoard to divide fractions and complete stations where they work with fractional parts of a whole.
Curated OER
Population Pyramids
Students create a population pyramid based on current data for their final project country. They analyze data from comprehension trends of final project country. Students analyze populations of specific countries.
Curated OER
One Hundred Hungry Ants
Primaries read the book One Hundred Hungry Ants and solve word problems based on the book. In this word problems lesson plan, students will be able to find the factors of a number by organizing counters into equal rows.
Curated OER
Investigating the Sierpinski Triangle
Students solve and analyze the sierpinski's triangle. In this geometry lesson, students identify properties and theorem of triangles. They solve problems involving angles and sides of triangles.
Curated OER
The Sierpinski Triangle
Students investigate the Sierpinski triangle. In this geometry instructional activity, students define fractal curves and its relationship to triangles. They identify repeating sequences and relate it to fractals.
Curated OER
Organize Data
In this organizing data worksheet, learners complete the tally chart for 'Votes for Team Mascot' and then use the chart to answer the six questions.
Curated OER
Introduction to Scatter Plots and Correlation
Students examine the concept of scatter plots. They compare baseball statistics to locate the ones that correlate with winning, and identify the positive, negative, and no correlation in sets of data using MS Excel.
Curated OER
Learning About Graphics
Students practice using and filling in a spreadsheet. They also create graphs and charts that coorespond with the data. This is a unit comprised of four lesson plans.
Curated OER
Surname Survey
Students use data from the U.S. Census Bureau to determine whether last names in a local phone directory reflect the Census Bureau's list of the most common surnames in the country. In this surnames lesson plan, students use the Internet...


