Curated OER
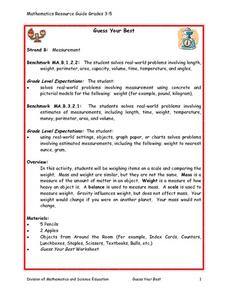
Guess Your Best
Students discuss situations when it is useful to know exact weight of object as opposed to estimated weight, estimate weight of various items, weigh them on scale using ounces and pounds, and compare their weights on Guess Your Best...
Curated OER
The Function Box
Students explore arithmetic and numerical patterns. After observing a teacher created function box, students describe a pattern and predict what will "come out" of the function box. They explore patterns such as geometric shapes,...
Curated OER
Trends of Snow Cover and Temperature in Alaska
Students compare NASA satellite data observations with student surface measurements of snow cover and temperature. They practice data collection, data correlations, and making scientific predictions.
Curated OER
And the Winner Is...
Third graders participate in an election project. They collect data to create a spreadsheet from which a graph is generated.
Curated OER
Angles and Arcs
Students discuss the sum of central angles and use string to create them on circles. They find the measure and length of both minor and major arcs.
Students give examples of concentric, similar, and congruent circles and congruent arcs.
Curated OER
American Political Thought: Minority Influence
Sixth graders brainstorm the reasons why people would want to leave their homeland to live in the United States. In groups, they research the political representation of the Board in New Haven, Connecticut. They also write a paper on...
Curated OER
Seeds of Life
Learners match real seeds with the corresponding names of fruits and vegetables. They answer discussion questions, and glue the seeds on the correct squares of a chart.
Curated OER
Weather... Or Not
Students observe and discuss the local weather patterns, researching cloud types and weather patterns for cities on the same latitude on the Internet. They record the data for 6-8 weeks on a graph, and make weather predictions for their...
Curated OER
Gravitational Factors
Young scholars identify the forces that affect the weight of an object. In groups, they determine the proper math model which can demonstrate the attraction between two objects based on gravity. They discuss the relationship between the...
Curated OER
Looking at Data
Third graders use two days to create, collect, display and analyze data. Classroom activities and practice build greater understanding to a variety of forms used to display data.
Curated OER
Rubber Gardens
Students recycle discarded automobile tires and create gardening sites for limited space areas.
Curated OER
Chessboard Challenge
Second graders read "The King's Chessboard" by David Birch. The teacher reads the story aloud and pauses at several points for students to calculate the next number in a pattern of doubling.
Curated OER
Teaching The Scientific Method Using Adhesives
Students use the six step scientific method to experiment with the differences in adhesives. Students test for tack, shear, and peel in these activities.
Curated OER
Smallest to Tallest - Where is the Middle?
Third graders measure each other's height and find the mean, median, and mode for the height of students in their class. They line up tallest to shortest and discuss the most appropriate measure of central tendency for the class.
Curated OER
Statistical Specimens
Third graders are introduced to statistical vocabulary. They complete an online activity that asks them to calculate the mean, median and mode for a set of data.
Curated OER
Temperature Probe
Fourth graders perform activities that involve electronic measurements through probe software. Students collect data and create a variety of visual formats: graphs, charts, tables, and gauges. They compare and contrast their data to...
Curated OER
Mass Transit
Students explore the world of mass transit and how it affects their community as well as how it attempts to reduce our pollution mass. Included as well are the environmental and social factors relating to mass transit. They read and...
Curated OER
Data Analysis, Probability, and Statistics: Exploring Websites
Students measure their pulse rates and place the number on the board. They arrange the numbers in order and discuss the differences between isolated facts and data. Students explore websites that relate to data analysis and report their...
Curated OER
Magic Mountain Coaster Computation
Students use the Internet to do research on the roller coasters at Magic Mountain Amusement Park. They must use mathematical formulas to calculate the highest and fastest coaster at the park.
Curated OER
Introduction to Graphical Representation of Data Sets in Connection with Nuclear Decay
Students record data, make observations, and share in experimentation and discussion of numerical experiments.
Curated OER
Pumped Up Gas Prices
Students spend one month keeping track of the mileage and gasoline amounts they or their family has used. Information is entered into a spreadsheet to help calculate the average gas prices over time.


