Curated OER
Circle Graphs
In this circle graphs worksheet, learners solve and complete 8 different problems that include word problems referring to two different circle graphs shown. First, they follow the directions for each problem and complete the table that...
Curated OER
Charting and Graphing Sales
Students analyze graphs, charts and tables. In this data analysis lesson plan, students practice creating and analyzing charts, graphs and tables corresponding to sales and surveys. This lesson plan uses data relevant to students and...
Curated OER
Tally Charts and Graphs
Fourth graders play the game 'Data Picking', where they collect data, place the data into a tally chart, and choose the circle graph that best represents the data. They go to the Mathfrog website and select 'Picking'. Students choose...
Sri Atmananda Memorial School
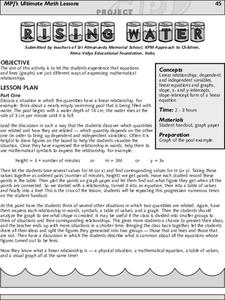
Rising Water
An engaging, and not to mention attractive, lesson plan has prealgebra and beginning algebra scholars examining linear relationships. They consider the rising water level as a swimming pool is being filled. They do so by charting and...
Curated OER
Exploring Renewable Energy Through Graphs and Statistics
Ninth graders identify different sources of renewable and nonrenewable energy. In this math lesson, learners calculate their own carbon footprint based on the carbon dioxide they create daily. They use statistics to analyze data on power...
Curated OER
Yummy Math
Young mathematicians use bags of Skittles to help them gain practice in graphing and organizing data. They work in pairs, and after they have counted and organized their Skittles, they access a computer program which allows them to print...
Curated OER
Math On the Job
Investigate different types of math required for specific jobs. In this math in occupations activity, use the Internet to research what type of math one might need to know in order to be successful in different jobs. Complete a related...
Curated OER
Data Analysis: Graphs, Charts, Tables, Statistics
In this data analysis worksheet, students interpret data in 5 problems involving graphs, tables, and scatterplots. Students construct 1 stem and leaf plot and find the mean, median, and mode of a data set.
Curated OER
Then and Now
Students conduct research and use census data to compare different times and places. In this census lesson, students interpret data from charts and graphs, comparing census information from two time periods as well as from two different...
Alabama Learning Exchange
Tiger Math Graphing
Learners practice various skills using the book Tiger Math: Learning to Graph from a Baby Tiger. After listening to the story, they create a pictograph using data collected from the text. They also color a picture of a tiger, collect...
Beyond Benign
Municipal Waste Generation
Statistically, waste may become a problem in the future if people do not take action. Using their knowledge of statistics and data representation, pupils take a look at the idea of waste generation. The four-part unit has class members...
Balanced Assessment
Movie Survey
Movie preferences will get your classes talking! Individuals read a pie graph and construct a bar graph using the same information. They then answer questions specific to the data and sample size.
West Contra Costa Unified School District
Quadratic Equations — What We Know
Everything you could possibly want to know about quadratic equations, all in one resource. Instructors demonstrate how to translate between different forms of quadratics (equation, table of values, graph, verbal description) and finding...
West Contra Costa Unified School District
Multiple Representations of Equations
class members first work through finding the equation, table of values, graph, and key features of a linear function expressed verbally. Individuals then work through several more problems given different representations.
Wisconsin Online Resource Center
Oversized Inch
Each member of the class creates their own paper ruler. Using their ruler, kids walk around the room measuring the objects you've specified. Discuss how items should be measured to the 16th of an inch, the smallest unit on their ruler....
Curated OER
Summer Body Activity: As Big as Me!
Learners explore things that are their size, literally. In this early childhood lesson plan, students use their bodies for measuring and comparing sizes as they work in pairs to complete the activity.
Curated OER
All About Graphs
Students practice organizing data by creating graphs. In this statistics lesson, students survey the class about favorite colors and create a bar graph using the data. Students complete a test based on pet and animal statistics.
Curated OER
Special Ed. Resource
Ways to organize data is the focus of this math PowerPoint. Students view slides that define and give descriptions of a variety of graphs, and how mean, median, and mode are found. A good visual tool which should benefit almost all types...
Curated OER
Favorite Food
Students are given three choices of food. They then decide on their favorite and predict what the class's favorite food will be. After the teacher enters the data into the computer, students gather around the computer to view the...
Curated OER
Interpreting Data from Birdfeeders
What kinds of birds live in your area? Read a book about birds to your learners and explore their feeding patterns. Charts and graphs are provided in this three page packet, but consider assigning the basic questions if using with young...
Curated OER
Graphing
Learners collect data to create different types of graphs-line, pie, and bar graphs. They use StarOffice 6.0 to create graphs.
Math Moves U
Collecting and Working with Data
Add to your collection of math resources with this extensive series of data analysis worksheets. Whether your teaching how to use frequency tables and tally charts to collect and organize data, or introducing young mathematicians to pie...
Willow Tree
Histograms and Venn Diagrams
There are many different options for graphing data, which can be overwhelming even for experienced mathematcians. This time, the focus is on histograms and Venn diagrams that highlight the frequency of a range of data and overlap of...
US Department of Commerce
Featured Activity: Population Change Over Time
Keep track of a state's population. After a brief discussion on how population data is used for funding, individuals look at population changes over time. Pupils find the population of two states using three different censuses. They then...


