Curated OER
Where's the Barbecue?
Learners identify the major landforms, regions and rivers on a map of South Carolina. They compare the locations of the major Native American groups in the state as well. They chart where barbecue restaurants are located and write...
Curated OER
Virtual Vacation
Students select a foreign city, research the city using the Internet, and plan an eleven-day vacation to that city. This lesson is ideal for a social studies classroom and includes ideas for using iMovie, Excel, and MS Works or AppleWorks.
Curated OER
Writing Directions for Mathematical Activities
Fifth graders reorganize comic strips to have them make sense, complete outline and organize their thoughts into outline form to explain directions,
and use that outline to complete their own directions for geometry activities.
Curated OER
Memory Book - A Cooperative Learning Experience
Students document sections of their life through pictures, stories, and video to create an English "memory book". They use photographs, video and edited video which includes their history, includes calculated growth, and genetic...
Curated OER
Honey ! I Blew Up The Bee!
Second graders complete a variety of bee-themed activities. They consider the importance of honeybees in food production, conduct Internet research, prepare foods using honey, complete puzzles and compile a portfolio of their work.
Curated OER
Aruba Cloud Cover Measured by Satellite
Students analyze cloud cover over Aruba. They compose and submit written conclusions which include data, analysis, errors in data collection, and references.
Curated OER
Kincaid Creatures
Students brainstorm a list of nocturnal and diurnal wild animals they see in their community and discuss how the animals would be different if they were living during the Ice Age. Using a handout, they discover how archeologists record...
Curated OER
A World Of Matter
First graders complete a variety of experiments with solids, liquids and gases. They read books about matter, identify the characteristics of solids, liquids and gases and the sort and classify a variety of matter. Students make...
Curated OER
Instructional Software Resources for Grades K-3
Learners become familiar with teh selection, evaluation, and use of instructional software for 4-8 classroom. They download software demos from the web and discuss critiquing software. Students browse software evaluations on web sites.
Curated OER
VAcations in Northern California
Students explore the natural resources and National Parks of Northern California that are commonly visited by people traveling in the United States. They use maps to locate various sites, plan a highway travel route and use the internet...
Beacon Learning Center
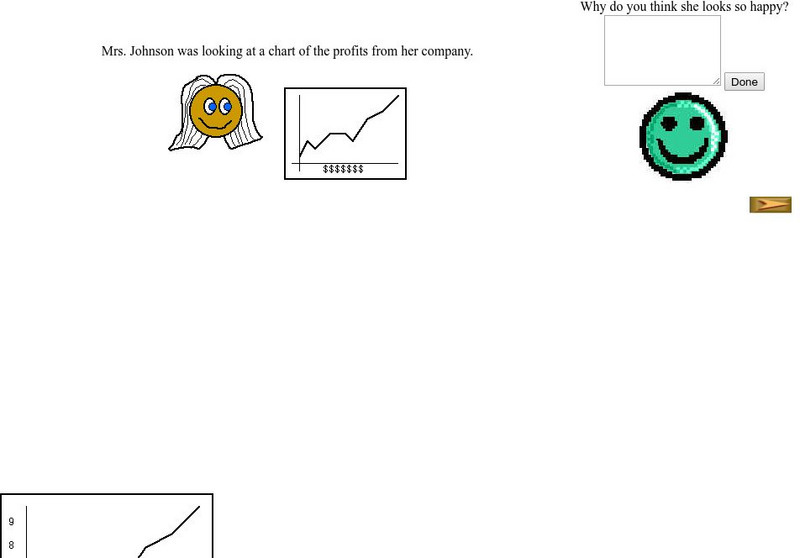
Beacon Learning Center: Interpreting Line Graphs
This site is a lesson on creating and interpreting a line graph. It explains how a line graph is created and then asks questions about what is learned from the data. Students type in open responses, and answers and feedback follow.
McGraw Hill
Glencoe: Self Check Quizzes 2 Circle Graphs
Use Glencoe's Math Course 2 randomly generated self-checking quiz to test your knowledge of circle graphs. Each question has a "Hint" link to help. Choose the correct answer for each problem. At the bottom of the page click the "Check...
Other
Delta State University: Lesson Plan 3: Pie Graphs
The students will gather, organize, and display data in an appropriate pie (circle) graph using M&M's! [PDF]
McGraw Hill
Glencoe: Self Check Quizzes 1 Circle Graphs
Use Glencoe's randomly generated self-checking quiz to test your knowledge of circle graphs. Each question has a "Hint" link to help. Choose the correct answer for each problem. At the bottom of the page click the "Check It" button and...
Math Planet
Math Planet: Pre Algebra: Circle Graphs
Learn about circle graphs or pie charts through examples and a video lesson.
E-learning for Kids
E Learning for Kids: Math: Group of Pyramids: Fractions and Graphs
On this interactive website, students practice various math skills using a real-life scenario at the pyramids. Those skills include showing percentages as fractions and decimals and interpreting data in a sector graph.
PBS
Pbs Learning Media: Everyday Algebra Plus: Targeted Math Instruction
Algebra lesson focuses on using patterns and relationships to write equations with two variables to represent relationships and patterns in real-world problems, plotting ordered pairs on a coordinate grid, and interpreting the meaning of...
Purple Math
Purplemath: Graphing Linear Equations: T Charts
A nice tutorial on how to graph linear equations. Goes through the process step by step and gives numerous examples.
The Math League
The Math League: Using Data and Statistics: Pie Charts
This introductory tutorial about statistical graphing with four examples of how pie charts (circle graphs) are constructed and read.
Scholastic
Scholastic: Bars, Lines, and Pies
Young scholars will learn and reinforce skills for creating, applying and analyzing pie charts, bar graphs and line graphs.
Texas A&M University
Wtamu Virtual Math Lab: Beginning Algebra: Reading Graphs
A good introduction to reading bar, line, and double line graphs, and drawing and reading Venn diagrams. Contains definitions and examples of these types of charts and graphs as well as practice exercises that ask you to answer questions...
University of Cambridge
University of Cambridge: Maths and Sports: Match the Matches
Decide which charts and graphs represent the number of goals two football teams scored in fifteen matches. This data handling activity is designed to get children talking meaningfully about mathematics, presenting and justifying...
Math Is Fun
Math Is Fun: Data Graphs
Create and customize a bar graph, line graph, or pie chart based on a set of data and print it out.
Math Is Fun
Math Is Fun: Pie Chart
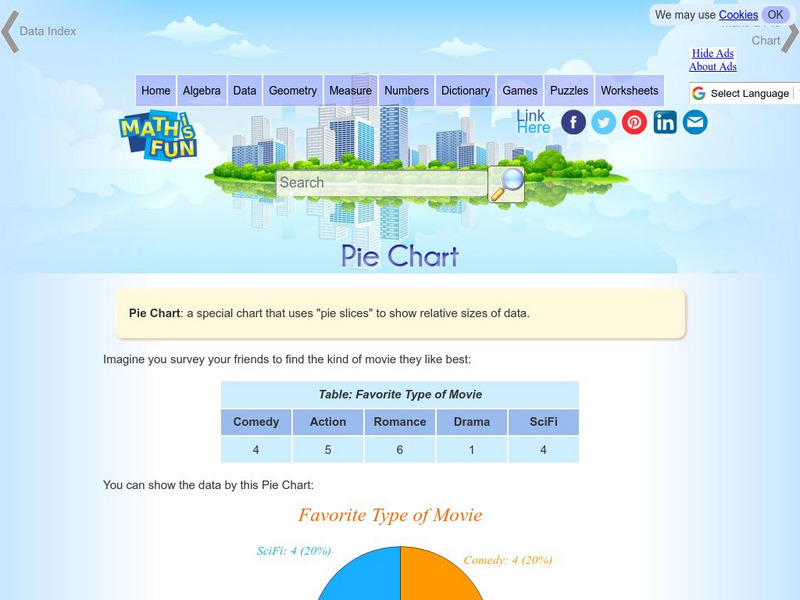
Explains, with examples, what a pie chart is and how to make one. Includes a set of practice questions.


