Virginia Department of Education
Curve of Best Fit
Which function models the data best? Pupils work through several activities to model data with a variety of functions. Individuals begin by reviewing the shapes of the functions and finding functions that will fit plotted data points. By...
K12 Reader
St. Patrick’s Day Word Search
Get in the St. Patrick's Day spirit with a 12-word, word search puzzle!
Los Angeles County Office of Education
Assessment For The California Mathematics Standards Grade 4
Have scholars show what they know with a 20-page assessment aligned to the California State Standards. The test covers concepts such as large and whole numbers, all four mathematical operations, fractions, decimals, geometric figures,...
Curated OER
Destination of Slaves in 1800
In this slave trade worksheet, students use the provided Atlantic Slave Trade statistics to create a pie chart and a bar graph. Students also respond to 4 short answer questions.
Curated OER
Third Grade Math
For this math review worksheet, 3rd graders answer multiple choice questions about probability, bar graphs, pictographs, and more. Students complete 25 multiple choice questions.
Curated OER
World Oil Packet
In this oil consumption worksheet, students analyze the data about oil consumption and production in 3 graphs. Students then respond to 12 questions about the data.
Curated OER
Find and Color
For this early childhood shape recognition worksheet, students find circles, triangles, and rectangles in a picture and color them according to the instructions. Students graph the number of each of the 3 shapes on the provided table.
Curated OER
Morning Math / Homework Math
In this math worksheet, students complete ten exercises reviewing basic math skills related to place value, money, time, number sense, and graphing. A Homework Math sheet is also included reviewing the same skills.
Curated OER
Worksheet 22 - Spring 1996
students examine the potential of creating the involute for a circle. They use the concept to create new parametric equations. They graph the picture for each.
Curated OER
Worksheet 22-Fall 1995
In this math worksheet, students examine the graph of the derivative. Then they determine the critical points that correspond to the relative extrema.
Curated OER
Applications of Derivatives: Concavity and Optimization
In this derivatives worksheet, students sketch the graph of a function by determining the local maxima, minima and inflection points. They graph a second function when given the interval. Students solve two word problems involving...
Curated OER
Worksheet 30
In this math worksheet, learners imagine a situation where a weight is attached to a string and it is swung in a circle. Then they use vectors and derivatives to describe the motion.
Curated OER
Understanding and Computing Riemann Sums
In this Riemann sum learning exercise, students use the Riemann sum to determine the volume of a square pyramid and the estimates of area around a circle. This four-page learning exercise contains 18 problems.
Curated OER
Worksheet 35 - Fall 1995
In this math worksheet, students sketch the graphs labeling the point of intersection in the first quadrant. Then they find the area of Ω.
Curated OER
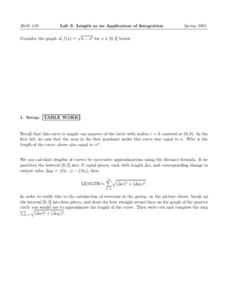
Lab 3: Length as an Application of Integration
In this integration worksheet, students graph a function that is a quarter circle curve. They calculate lengths of curves by approximation using the distance formula. Students use a computer program to calculate the approximation of the...
Curated OER
Intermediate Level Science Test
In this science test worksheet, 8th graders complete a comprehensive grade eight exam. Students respond to 70 questions consisting of fill in the blank, short answer, and chart and graph completion.
Curated OER
Factoring Quadratic Trinomials
In this factoring trinomials worksheet, 9th graders solve and complete 36 various types of problems. First, they write each trinomial in factored form. Then, students write all of the factor pairs of the third term and circle the pair...
Curated OER
SOL Review
For this SOL worksheet, students solve inequalities, identify equivalent fractions and graph polynomial functions. They find the geometric means and compute average rates. This eight-page worksheet contains 20 multiple-choice problems.
Curated OER
Farming - Ireland
In this farming activity, students explain what is meant by sustainable development. Students review how rain develops. Students determine how climate effects crops that can be farmed. This activity has 4 graphic organizers, 1 graph, 20...
Curated OER
Same Worksheet
In this objects that are the same worksheet, students look at the sports balls in each of three rows and then circle the sports ball that is the same as the first ball in each row.
Curated OER
New York State Testing Program: Mathematics Test Book 1
In this mathematics test bookelt, students solve problems studied during the year. They solve problems covering topics such as probability, angle intersection, commission, percent, exponents, similar figures, and reading and...
Curated OER
Regents High School Examination Comprehension Examination in English Session One (2005)
In this Regents High School Examination Comprehensive Examination worksheet, students listen to an account and write an essay response. Students then read a text and study a graph and write an essay based on the information given.
Curated OER
Maximum and Minimum Word Problems
In this maximum and minimum worksheet, students solve and complete 10 various types of word problems. First, they find the numbers if the product of the square of one of the numbers with the cube of the other number is to be a maximum....
Curated OER
Verbal and Algebraic Expressions
In this expressions worksheet, students solve and complete 30 various types of problems that include defining both verbal and algebraic expressions. First, they translate each verbal expression into an algebraic expression and vice...
Other popular searches
- Percent Circle Graph
- Circle Graph Worksheet
- Circle Graph Template
- Interpreting Circle Graphs
- Circle Graph Protractor
- Circle Graph Activity
- Reading Circle Graphs
- Circle Graphs Pie Charts
- Circle Graph Central Angle
- Bar and Circle Graphs
- Circle Graph in Excel
- Family Budget Circle Graph


