Curated OER
Exponents and Logarithms Test
In this Algebra II/Pre-calculus worksheet, students solve advanced logarithmic and exponential equations. The two page worksheet contains ten multipart problems. Answers are not provided.
Curated OER
Coordinate Geometry
For this geometry worksheet, learners calculate the midpoint and distance between two points. They use the correct formula to solve the area and perimeter of polygons. There are 20 multiple choice questions with an answer key.
Curated OER
Grade 5 Math Test
In this grade 5 reading quiz, 5th graders complete a 26 question multiple choice quiz covering a variety of grade 5 reading concepts. Answers may be submitted on-line.
Curated OER
Sunshine Math- 2
In this math applications worksheet, students solve 6 varied problems that include estimation, money, basic operations, pictographs and geometry.
Curated OER
Vectors
In this Pre-calculus worksheet, students solve problems designed to help students develop a geometric visualization of vectors. The three page worksheet contains six multi-part questions. Answers are not included.
Curated OER
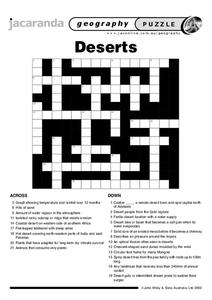
Deserts Crossword
In this geography crossword puzzle, students answer twenty-one questions about deserts. Among the topics are plants, animals, and terrain.
Curated OER
Parametrics 1
In this parametric worksheet, students sketch given inequalities and use trigonometry functions to eliminate the parameters. They write equations of a line under given parameters. This four-page worksheet contains 11 multi-step problems.
Curated OER
Worksheet 29
In this math learning exercise, students investigate how time is related to the concept of increasing or decreasing velocity. Then they consider times and answer the questions of whether the velocity is changing.
Curated OER
Informational Reading: Electronics Are Made from Resources
In this comprehension worksheet, students read about the making of a computer: circuit boards, hard drives, monitors and plastic housings. Students then answer 3 multiples choice questions.
Curated OER
Technology has a Solution!
In this technology worksheet, students summarize four things they learned about technology and the environment. Students then write a report that outlines how technology is solving environmental issues.
Curated OER
A Look at the Life That Electronics Lead
In this comprehension worksheet, learners fill in ways on a graphic organizer that people or companies can conserve energy, reduce waste or minimize the impact to the environment. Next, students solve 3 "environmental" math word problems.
Curated OER
Sight Word Activity Pages
In this sight word worksheet, students are given a calendar naming 4 weeks worth of sight words and their activities for each school day of the week. Activities follow on subsequent pages.
Curated OER
Max/Min Problems for Review
In this Algebra II/Pre-Calculus learning exercise, students determine the points of inflections for various functions and use the answers to complete a riddle. The one page learning exercise contains seven problems. Answers are included.
Curated OER
Deserts Puzzle
In this geography worksheet, students complete a crossword puzzle referring all to deserts. They identify the various types of desert land and what plants and animals can survive in these lands. Also, students identify the people who...
Curated OER
1Word and Letter Match Puzzle
In this word and letter match worksheet, students match groups of 3 letters to words that contain each set. A reference web site is given for additional activities.
Government of Alberta
Learn Alberta: Math Interactives: Exploring Data Display and Graphs
This multimedia Learn Alberta math resource focuses on graphing data. In the video portion, students will see how math is involved in the display of merchandise in stores. The accompanying interactive component provides an exploration...
Math Graphs
Houghton Mifflin: Math Graphs: Percents and Circle Graphs 1 [Pdf]
Students calculate the percent of the total income for sources of income and expenses. Learners then use this information to create a circle graph. The handout is available in PDF format.
Math Graphs
Houghton Mifflin: Math Graphs: Percents and Circle Graphs 2 [Pdf]
Students calculate the percent of the total expenses for sources of income and expenses. Learners then use this information to create a circle graph. The handout is available in PDF format.
Government of Alberta
Learn Alberta: Math Interactives: Exploring Election Data
Using actual Alberta provincial election results, students have the opportunity to interpret election data using a variety of graph types. Pictographs, line graphs, bar graphs, circle graphs, and data tables are covered in this...
Other
Tulpehocken Area School District: Graphing and Analyzing Scientific Data
Student worksheet with explanation of pie, bar, and line graphs, the parts of a graph, and the definition of mean, median, and mode. This summary is followed by an exercise for each type of graph within a scientific context.
TOPS Learning Systems
Top Science: Pi Graph [Pdf]
An activity where students explore and graph the relationship between the diameter and the circumference of a circle.
Math Graphs
Houghton Mifflin: Math Graphs: Circles of Curvature 1 [Pdf]
The handout examines the centers of curvature of a curve. Students use a compass to sketch the circles from a given curve and its evolute. The handout is available in PDF format.
Math Graphs
Houghton Mifflin: Math Graphs: Circles of Curvature 2 [Pdf]
The handout examines the centers of curvature of a curve. Students use a compass to sketch the circles from a given curve and its evolute. The handout is available in PDF format.
Math Graphs
Houghton Mifflin: Math Graphs: Sketching an Isotherm [Pdf]
The exercise examines an isotherm, the hottest point, and the coldest point on a given circular plate. The handout is available in PDF format.
Other popular searches
- Percent Circle Graph
- Circle Graph Worksheet
- Circle Graph Template
- Interpreting Circle Graphs
- Circle Graph Protractor
- Circle Graph Activity
- Reading Circle Graphs
- Circle Graphs Pie Charts
- Circle Graph Central Angle
- Bar and Circle Graphs
- Circle Graph in Excel
- Family Budget Circle Graph


![Houghton Mifflin: Math Graphs: Percents and Circle Graphs 1 [Pdf] Unknown Type Houghton Mifflin: Math Graphs: Percents and Circle Graphs 1 [Pdf] Unknown Type](https://d15y2dacu3jp90.cloudfront.net/images/attachment_defaults/resource/large/FPO-knovation.png)
