Curated OER
How Do You Spend Your Time?
Pupils keep records and determine how much time they spend on certain activities. They insert the data into a spreadsheet. Students graphically display data in a bar graph and a circle graph.
Curated OER
Approximation of Pi
Students explore the concept of Pi. For this Pi lesson, students measure the circumference and diameter of a circle. Students record the diameter and circumference measurements from their classmates. Students enter the data into lists...
Mathematics TEKS Toolkit
Grade 6: Exploring c/d = pi
Introduce your math class to the perimeter of a circle. Teach them that pi describes the relationship between the circumference and the diameter. As a hands-on investigation, pairs or small groups use string to compare these two values...
Raytheon
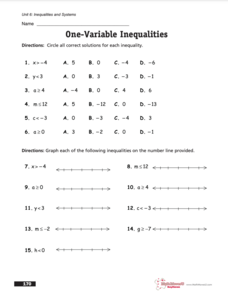
Inequalities and Systems
For this one variable inequalities worksheet, middle schoolers circle the correct solutions, complete graphing problems, and solve for the variables. Learners complete 37 problems.
Curated OER
Solar System Planet Research
For this space science worksheet, students collect data that includes information in a chart or graph to display in a group. They identify and describe various planet features of a specific planet of choice. Students write notes and the...
Curated OER
Mathematics Module
Delve into graphing! The concepts covered begin with basic graphing basic coordinates and algebraic expressions on coordinate planes, and build up to graphing linear inequalities and equations. Learners solve and simplify various...
Curated OER
Use Fractions to Compare
In this fractions worksheet, students use 3 circle graphs to complete 3 tables, then answer 3 questions, using the graphs to compare information in tables. Answers available on page 2.
Curated OER
Moving Out
Students determine their cost of living. In this determining their cost of living lesson, students think of ten necessary things they would need if they moved out of their parents house. Students research the cost of renting an...
Curated OER
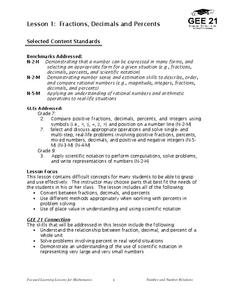
Fractions, Decimals, and Percents
Students connect different mathematical concepts. They create a circle graph. Students then create a question in which they collect data in order to convert fractions to decimals and decimals to percents.
Curated OER
Piece of Pie Chart
In this math worksheet, young scholars examine a pie graph which shows a student's homework over 2 hours. Students read the information, then use a pie chart template (divided into 24 parts) to make their own homework chart.
CK-12 Foundation
Ellipses Centered at the Origin: Lithotripsy
Investigate ellipses through the lens of medical applications. Pupils use a medical scenario to determine the equation of an ellipse. By using the interactive, learners determine the foci and major and minor axes of the ellipse that...
Curated OER
Three for the Money: The Degree/Diameter Problem
Students explore the concept of vertex-edge graphs. In this vertex-edge graphs instructional activity, students try to construct a graph with a given diameter, number of vertices, size, and planarity. Students construct various...
Curated OER
Segments Formed by Intersectiong Chords, Secants, and Tangents
Learners investigate the properties of segments formed which chords, secants, and tangents, intersect. The dynamic nature of Cabri Jr. allows students to form and verify conjectures regarding segment relationships.
Curated OER
Calculate Percentages
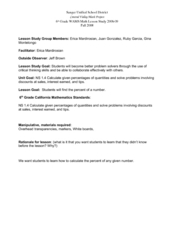
Sixth and seventh graders study the concept of finding the percent of a number. They calculate the percent of any given number. Pupils describe ways to use calculating percents in their daily life, and change percents into decimals,...
Curated OER
Parametric, Vector, Polar, and 3D Functions
Twelfth graders investigate the capabilities of the TI-89. In this calculus lesson, 12th graders explore the parametric equation for a circle, for arc length of curves, and for trajectories. Students investigate the symbolic and...
Curated OER
ou are the Researcher!
Students conduct a census at school. They collect data, tally it, and create a frequency table. Students display their data in three different types of graphs. They write complete sentences describing the graph.
Curated OER
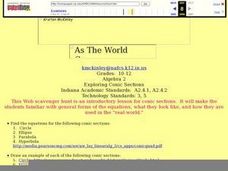
As The World Curves
Pupils partisipate in a web scavenger hunt on an introductory lesson for conic sections. They become familiar with general forms of the equations, what they look like, and how they are used in the real-world.
Curated OER
Bubble Gum Chemistry
Students explore the concept of graphing data. In this graphing data instructional activity, students determine the percentage of sugar in bubble gum. Students graph type of gum vs. sugar percentage. Students create a table of their data.
Curated OER
Opening the Case
Students participate in a class survey and then design an experiment and use graphs and statistics to assist them in solving a problem. They organize the results of the survey in a stem-and-leaf plot and find the range, median, mean, and...
EngageNY
Comparing Quadratic, Square Root, and Cube Root Functions Represented in Different Ways
Need a real scenario to compare functions? This lesson has it all! Through application, individuals model using different types of functions. They analyze each in terms of the context using the key features of the graphs.
K12 Reader
Displaying Data
It's important to learn how to display data to make the information easier for people to understand. A reading activity prompts kids to use context clues to answer five comprehension questions after reading several paragraphs about...
Inside Mathematics
Rugs
The class braids irrational numbers, Pythagoras, and perimeter together. The mini-assessment requires scholars to use irrational numbers and the Pythagorean Theorem to find perimeters of rugs. The rugs are rectangular, triangular,...
Cornell University
Garden Math
Young scientists must put their math caps on and figure out what fraction of each flower is in a raised flower bed. They must problem solve to simplify the fractions, and then graph the amount of flowers that are in different flower beds.
EngageNY
Ferris Wheels—Tracking the Height of a Passenger Car
Watch your pupils go round and round as they explore periodic behavior. Learners graph the height of a Ferris wheel over time. They repeat the process with Ferris wheels of different diameters.
Other popular searches
- Percent Circle Graph
- Circle Graph Worksheet
- Circle Graph Template
- Interpreting Circle Graphs
- Circle Graph Protractor
- Circle Graph Activity
- Reading Circle Graphs
- Circle Graphs Pie Charts
- Circle Graph Central Angle
- Bar and Circle Graphs
- Circle Graph in Excel
- Family Budget Circle Graph


