Curated OER
Cindy and Linda - Selling Lemonade
In this pie charts worksheet, learners use the pie chart to count how many glasses of Lemonade were sold by Cindy and Linda. Students complete the table and answer 3 questions.
Curated OER
Math & Social Science
Students are given data and are to calculate averages and yearly totals of how many cars travel the Tacoma Narrows Bridge. They also make a graph of the data.
Curated OER
E3 Practice Assessment - Pets
In this assessment worksheet, 3rd graders complete eight pages of math assessment. Students solve problems related to money and a bar graph. Students solve word problems involving rounding and computation.
Curated OER
Numeracy Practice- Going Out For Lunch
In this math learning exercise, learners complete the various types of activities that include graphs, data tables, and completing number sentences.
Curated OER
Data Days
Sixth graders practice collecting, organizing and displaying data. They create circle, bar, line and picto graphs. They analyze data in small and large sample groups.
Curated OER
Parabola
In this parabolas instructional activity, 10th graders solve and graph 12 different problems related to various types of parabolas. First, they determine the vertex and the y-intercept based on the graph illustrated for each. Then,...
Curated OER
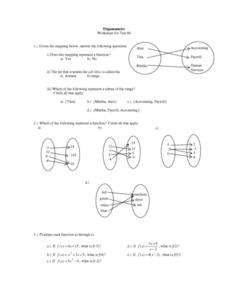
Trigonometry: Worksheet for Test #4
In this trigonometry worksheet, students determine whether given mappings are functions. They evaluate 5 functions for a given x value. Students graph 2 functions. They determine which ordered pairs are solutions to given functions....
Curated OER
Birthdays
Students collect data about the birth months of each classmate using a calendar. They make a table with the information before designing a pictograph using cupcake images. They answer questions using the graph.
Curated OER
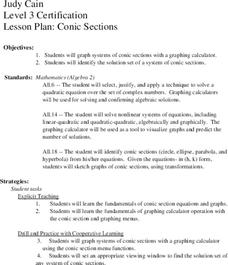
Conic Sections
Students, while using a graphing calculator, graph systems of conic sections as well as identify their solutions. They complete various word problems dealing with conic sections with their calculators. In addition, students sketch graphs...
Curated OER
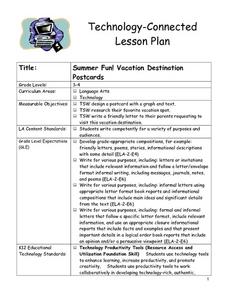
Summer Fun! Vacation Destination Postcards
Students design a postcard with a graph and text. They research their favorite vacation spot. Pupils write a friendly letter to their parents requesting to visit this vacation destination. Students use a Circle Map, to help fill in their...
Curated OER
Snake Sorting
In this sorting learning exercise, learners sort snakes with tongues out and snakes without their tongues out, count them, graph them and circle the one that has more. Students complete five activities.
Curated OER
Round and Round and Round We Go!
Students investigate motion using a CBL. In this algebra instructional activity, students collect and graph data on a coordinate plane. They define and identify amplitude and period of conic graphs.
Curated OER
Properties of Definite Integrals
In this definite integral worksheet, students evaluate the properties of definite integrals. Students graph their answers. This two-page worksheet contains two multi-step problems.
Curated OER
Polar Coordinates Game
In this algebra game, students pair off to plot polar coordinates on a circular graph. They attempt to hit each other by guessing their opponents location on the graph. This is a great way to reinforce the concept of polar coordinates....
Curated OER
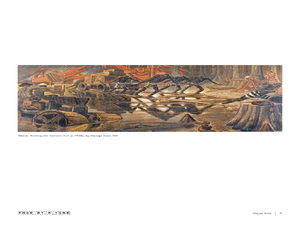
Analyzing Visual Symbols
Students analyze and identify visual symbols in everyday life and during a museum visit. In this visual symbol lesson, students study associated vocabulary such as analyze and interpret. They find and note attention getting symbols...
Curated OER
Equal Parts
In this equal parts worksheet, students, working with a partner, study, formulate and calculate the answers to six word problems or drawings.
Curated OER
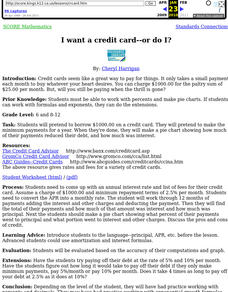
I want a credit card--or do I?
Students pretend to borrow $1000.00 on a credit card. They pretend to make the minimum payments for a year. When they're done, they make a pie chart showing how much of their payments reduced their debt, and how much was interest.
Curated OER
Graphing Polar Coordinates
Students define polar equations and learn to plot them. For this calculus lesson, students relate polar equations to real life scenarios such as plants and comic strips. They discuss and define the curves of polar equations.
Curated OER
Discovering Mitosis in Onion Roots
High schoolers discover the different stages of mitosis by examining onion roots under a microscope, drawing diagrams of what they see, and organizing collected data in a chart and create a pie graph from their lab data.
Curated OER
How's The Weather?
Students make a box and whiskers plot using the TI-73 graphing calculator. Each student would have their own calculator but they would work in small groups of two or three to help each other enter the data and make the plots.
Curated OER
Ready for Roots
Fourth graders sort seeds and predict what conditions are needed for them to germinate. They keep the seeds moist, observe and measure their growth and graph the results. As the seeds start to grow students compare and contrast the each...
Curated OER
Raisin the Statistical Roof
Use a box of raisins to help introduce the concept of data analysis. Learners collect, analyze and display their data using a variety of methods. The included worksheet takes them through a step-by-step analysis process and graphing.
Curated OER
Graphs And Ellipses
Learners become acquainted with linear graphs, the parabola and the rectangular hyperbola. Also prepare tables of paired values as preparation for plotting a line. They study the cartesian equation of an ellipse, with a worked example.
Curated OER
The Unit Circle
Students relate the trigonometric functions to the coordinates of the unit circle. They classify trigonometric functions as odd or even. Students determine the signs of trigonometric functions in each quadrant. They are explained that...
Other popular searches
- Percent Circle Graph
- Circle Graph Worksheet
- Circle Graph Template
- Interpreting Circle Graphs
- Circle Graph Protractor
- Circle Graph Activity
- Reading Circle Graphs
- Circle Graphs Pie Charts
- Circle Graph Central Angle
- Bar and Circle Graphs
- Circle Graph in Excel
- Family Budget Circle Graph


