Virginia Department of Education
Nonlinear Systems of Equations
Explore nonlinear systems through graphs and algebra. High schoolers begin by examining the different types of quadratic functions and their possible intersections. They then use algebraic methods to solve systems containing various...
Concord Consortium
Functions by the Slice
Piece by piece ... dismantling a function can highlight interesting patterns. The task asks learners to slice functions in sections with the same vertical change. They then recreate the graph with these slices positioned horizontally....
Curated OER
Expressing Geometric Properties with Equations
Algebra and geometry are not interchangeable. Demonstrate why not with a series of problems that deal with the equations of circles and equations of lines that meet specific criteria.
Curated OER
Study Buddies - Bar Graphs
In this data collection worksheet, learners work with a partner to make 3 small bar graphs after finding the proper number of circles on the first page. They look at a page of a variety of shapes and separate the circles into black,...
Curated OER
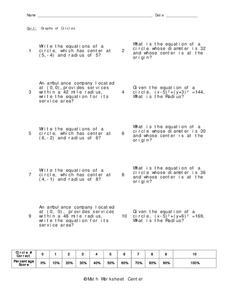
Graphs of Circles
In this graphs of circles worksheet, 10th graders solve and graph 10 different problems related to graphing various types of circles. First, they write the equations of a circle with a given center and radius. Then, students determine...
Curated OER
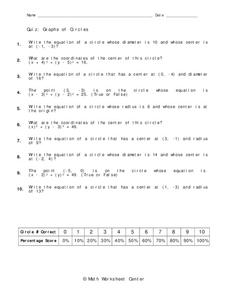
Graphs of Circles
In this graphs of circles worksheet, 10th graders solve 10 different problems that include the graphs of circles with various measurements. First, they write the equation of a circle whose diameter is a given number and whose center is...
Curated OER
Graphs and Equations of Conic Sections Practice Test
In this conic section worksheet, learners complete a thirty-one question practice test containing matching and problem solving conic equation and conic graph problems. The solutions are provided.
Curated OER
Graphing Linear, Circular, and Parabolic Inequalities
For this graphing worksheet, students are given nine inequalities and then must graph five of their intersections. A grid and cartoon hint are provided.
Curated OER
Using Data to Make Graphs: Pretest
In this data worksheet, 5th graders answer multiple choice questions on data and graphs. Students answer 10 multiple choice questions.
Curated OER
Understanding Line Graphs
In this line graphs worksheet, 4th graders study a line graph with time and height and points A-D. Students answer four short answer questions relating to the line graph.
Curated OER
Reading Graphs
For this reading graphs practice worksheet, students examine a graph and respond to 5 questions that require them to record the coordinates of 5 shapes on the gridded graph.
Curated OER
Parabola - Equations and Graphs
In this parabola activity, students match graphs of parabolas to the correct equation. This one-page activity contains ten matching problems.
Curated OER
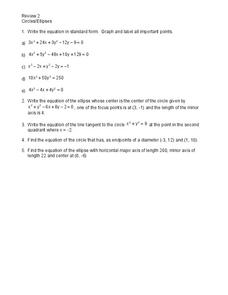
Circles and Ellipses
In this circles and ellipses worksheet, students solve and complete 5 different types of problems. First, they write each equation in standard form. Then, students graph and label Write the equation of the ellipse whose center is the...
Curated OER
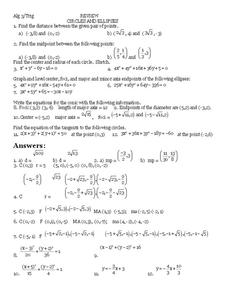
Circles and Ellipses
In this circles and ellipses worksheet, students solve and complete 12 different types of problems. First, they find the distance between the given pair of points. Then, students find the center and radius of each circle and sketch. They...
Curated OER
Reciprocal Graphs
In this graphing worksheet, students graph 8 reciprocal graphs. Students graph the reciprocal of a given graph. Students graph reciprocal cubics, quadratics, linear, circles, and fourth degree functions.
Curated OER
Pictures, Graphs and Diagrams
In this algebra worksheet, students define vocabulary related to circles, and other conics. They graph hyperbolas and eclipse. There are 20 questions.
Curated OER
Froot Loop Favorites
In this Froot Loop favorites worksheet, students solve and complete 3 different problems that include data tables related to their Froot Loop favorites. First, they determine what fraction of the class voted for each color listed in the...
Curated OER
Discovering PI
In this pi worksheet, students identify and complete 4 different problems that include pi and graphing data points. First, they complete the chart at the top by measuring the diameter and circumference of each object. Then, students plot...
Curated OER
7th Grade Math Worksheet
In this integers activity, 7th graders solve 10 different problems that include various types of integers and graphs. First, they determine the sum of 3 consecutive integers. Then, students find the ratio between 2 areas of similar...
Curated OER
Generate Measurement Data Word Problems
Using a set of simple data, learners create a line plot to organize the information. This data includes only single-digit numbers and the highest number is six. Because the answer is explained and illustrated at the bottom, project this...
Concord Consortium
Outward Bound
Just how far can I see? The short assessment question uses the Pythagorean Theorem to find the distance to the horizon from a given altitude. Scholars use the relationship of a tangent segment and the radius of a circle to find the...
Curated OER
Understanding Statistics
In this statistics worksheet, students examine and interpret pictographs and line graphs. Students analyze the provided data in order to create bar graphs, circle graphs, and box and whisker plots. The nine page worksheet accompanies a...
Curated OER
Circles
In this circles worksheet, 10th graders solve and complete 16 various types of problems. First, they state the center and radius for the given equation and graph. Then, students determine if each point is on the circle, in its interior,...
Curated OER
Introductory Algebra Chapter 3 Review
In this math worksheet, students find the solutions to the problems while interpreting the line, bar, and circle graphs. The examples are given to help in the context of each objective.
Other popular searches
- Percent Circle Graph
- Circle Graph Worksheet
- Circle Graph Template
- Interpreting Circle Graphs
- Circle Graph Protractor
- Circle Graph Activity
- Reading Circle Graphs
- Circle Graphs Pie Charts
- Circle Graph Central Angle
- Bar and Circle Graphs
- Circle Graph in Excel
- Family Budget Circle Graph


