Curated OER
Guess the Card -Probability
This site is used for distance education purposes and professional development of teachers
Curated OER
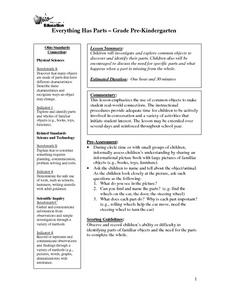
Everything Has Parts
Students investigate and explore common objects to discover and identify their parts. They also are encouraged to discuss the need for specific parts and what happens when a part is missing from the whole.
Better Lesson
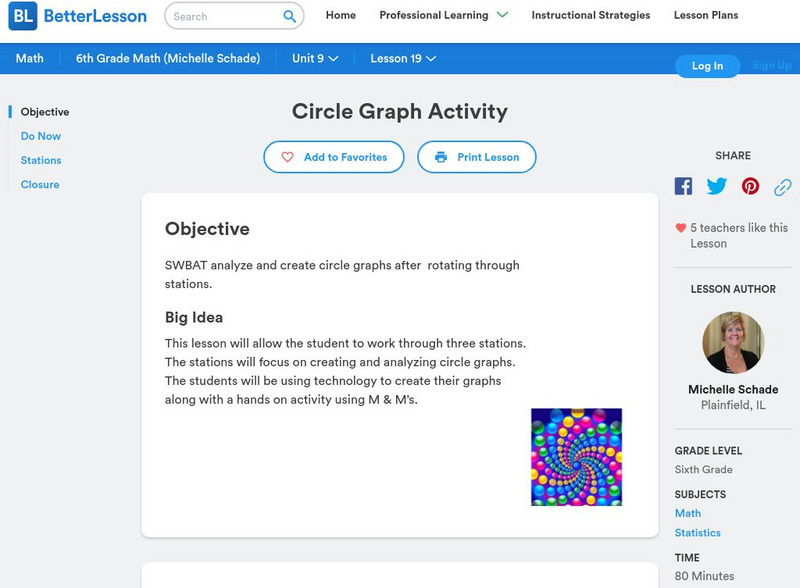
Better Lesson: Circle Graph Activity
This lesson will allow the student to work through three stations. The stations will focus on creating and analyzing circle graphs. The students will be using technology to create their graphs along with a hands-on activity using M&M's.
Better Lesson
Better Lesson: Circle Graph Activity
This lesson will allow the student to work through three stations. The stations will focus on creating and analyzing circle graphs. The students will be using technology to create their graphs along with a hands on activity using M &...
Government of Alberta
Learn Alberta: Math Interactives: Exploring Data Display and Graphs
This multimedia Learn Alberta math resource focuses on graphing data. In the video portion, students will see how math is involved in the display of merchandise in stores. The accompanying interactive component provides an exploration...
Texas Instruments
Texas Instruments: Circular Functions
In this activity, students find intercepts of circular function graphs. They also investigate the characteristics of such graphs.
Oswego City School District
Regents Exam Prep Center: Circles
Use this lesson, practice quiz, and activity when planning classroom instruction on graphs and equations of circles.
National Council of Teachers of Mathematics
Nctm: Illuminations: Circle Grapher
A computer applet that will draw any circle graph with student's data input.
Texas Instruments
Texas Instruments: Grandparents and Special Friends Day
This lesson was designed for our Grandparents and Special Friends day. It can be used for any visitation day, or an open house. The lesson is designed to review percent of a whole and the sector of the circle representing the percentage....
Texas Instruments
Texas Instruments: Math Today the Next Frontier for Flight
This activity provides students the opportunity to gain experience in creating circle graphs on the calculator and provides an excellent real-world review of computation with percents.
Shodor Education Foundation
Shodor Interactivate: Circle Graph
This site shows how to set up your own pie chart for papers and projects. Very colorful and it is free.
Oswego City School District
Regents Exam Prep Center: Circles and Angles
A wealth of material to supplement classroom instruction on circles, angles in circles, and arcs. Find lessons with formulas, diagrams, and example problems with step-by-step solutions, multiple-choice practice quizzes, and activity...
PBS
Pbs Kids Afterschool Adventure!: Operation: Data Saves the Day Activity Plan
Data comes to the rescue! Children will collect, analyze, and represent data as they try to dodge a series of catastrophes faced by characters from their favorite PBS Kids shows.
University of Regina (Canada)
University of Regina: Math Central: Circle and Bar Graphs
Students evaluate data, use the data to make different types of graphs, and then investigate these graphs. Teacher's notes are included along with downloadable versions of the activity. This lesson is from a group of lessons that uses...
PBS
Pbs: The Lowdown: Exploring Changing Obesity Rates Through Ratios and Graphs
In these KQED Lowdown infographics, explore how adult obesity rates in the United States, as measured by body mass index (BMI), have dramatically changed in the past half-century. A circular graph and a pictograph depict data by decade,...
Government of Alberta
Learn Alberta: Math Interactives: Exploring Election Data
Using actual Alberta provincial election results, students have the opportunity to interpret election data using a variety of graph types. Pictographs, line graphs, bar graphs, circle graphs, and data tables are covered in this...
Texas Instruments
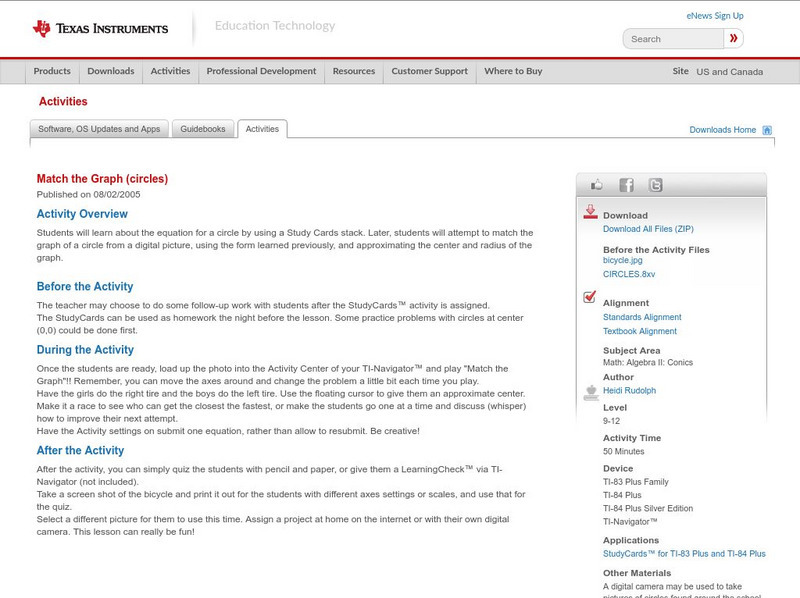
Texas Instruments: Match the Graph (Circles)
Students will learn about the equation for a circle by using a Study Cards stack. Later, students will attempt to match the graph of a circle from a digital picture, using the form learned previously, and approximating the center and...
Texas Instruments
Texas Instruments: Mc Dougal Littell Algebra 2: Graph Equations of Circles
Students can use the TI-84 Plus family to graph equations of circles.
Oswego City School District
Regents Exam Prep Center: Unit Circle
Two hands-on lab activities for instructors to use when teaching about the coordinate graphs of the sine, cosine, and tangent functions derived from a unit circle. The graphs of the reciprocals of the three functions are investigated....
Texas Instruments
Texas Instruments: Mc Dougal Littell Middle School Math: Making Data Displays
Students will create data displays using a scatter plot and a line graph of the data and a circle graph of survey data.
Texas Instruments
Texas Instruments: Picturing Probabilities of Number Cube Sums
Students use ideas of ratio and proportion to investigate various ways to make a circle graph. Students create graphs to display the probabilities of the different sums that can be generated with two number cubes. [Requires Adobe Reader.]
Science Education Resource Center at Carleton College
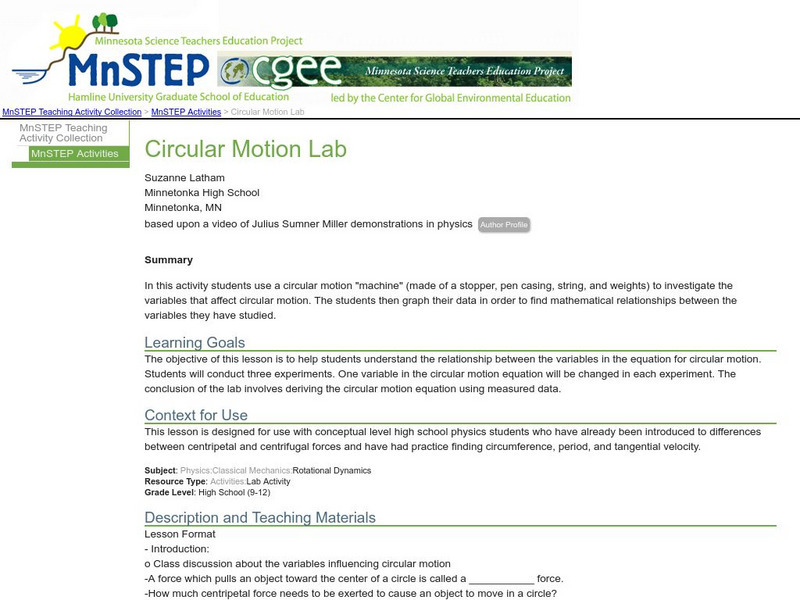
Serc: Circular Motion Lab
In this activity students use a homemade circular motion machine to investigate the variables that affect circular motion. The students then graph their data in order to find mathematical relationships between the variables they have...
Oswego City School District
Regents Exam Prep Center: Categorizing Data
Three lessons on different types of data (qualitative, quantitative, univariate, bivariate, biased data) as well as a practice activity and teacher resource.
ClassFlow
Class Flow: Graphs
[Free Registration/Login Required] This flipchart presents bar and double bar graphs, line and double line graphs, pictographs, histograms, and circle graphs with review activities and web links for practice.


