TOPS Learning Systems
Top Science: Pi Graph [Pdf]
An activity where students explore and graph the relationship between the diameter and the circumference of a circle.
Shodor Education Foundation
Shodor Interactivate: Pie Chart
Students investigate how a pie chart can be used to display data graphically. The resource includes the activity and instructor resources.
Shodor Education Foundation
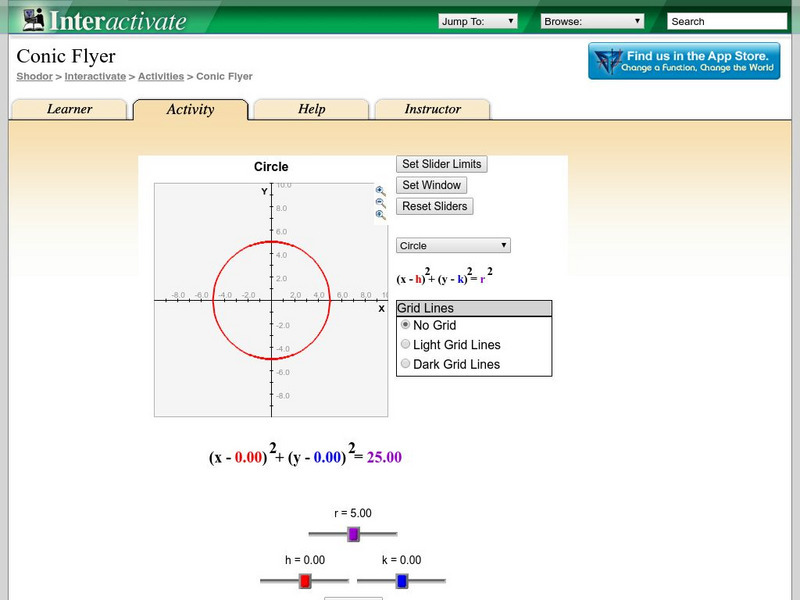
Shodor Interactivate: Conic Flyer
"This applet allows the user to create graphs of conic sections. Using slider bars, one can manipulate the function to change the constant values and view the effects of those changes."
Other
Ctte: Geometer's Sketch Pad Activities
This site offers numerous activities for middle school and high school students to explore using Geometer's Sketch Pad.
Rice University
Rice University: The Hand Squeeze
Students will enjoy this data collection and class analysis experiment involving the time it takes for a hand squeeze to travel around a circle of people. From organizing the activity to collecting the data to making a table and graphing...
PBS
Pbs: Mathline Creature Feature Lesson Plan [Pdf]
An interdisciplinary math, science, and language arts lesson that engages students in an exploration of statistics. Through a study of various forest climates, students utilize data collection and analysis, classification, and graphing....
Texas Instruments
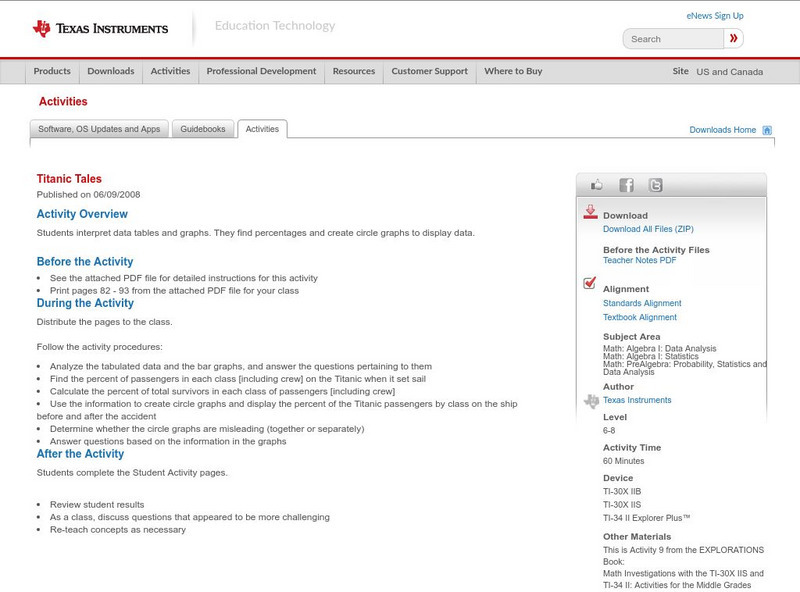
Texas Instruments: Titanic Tales
In this activity, students interpret data tables and graphs. They find percentages, and create circle graphs to display data.
Texas Instruments
Texas Instruments: Why Aren't There More Reds in My Bag?
Students use small bags of M&M's to make predictions, gather data, and display color distribution results in a circle graph. They explore the concept of ratios and sample size.
Texas Instruments
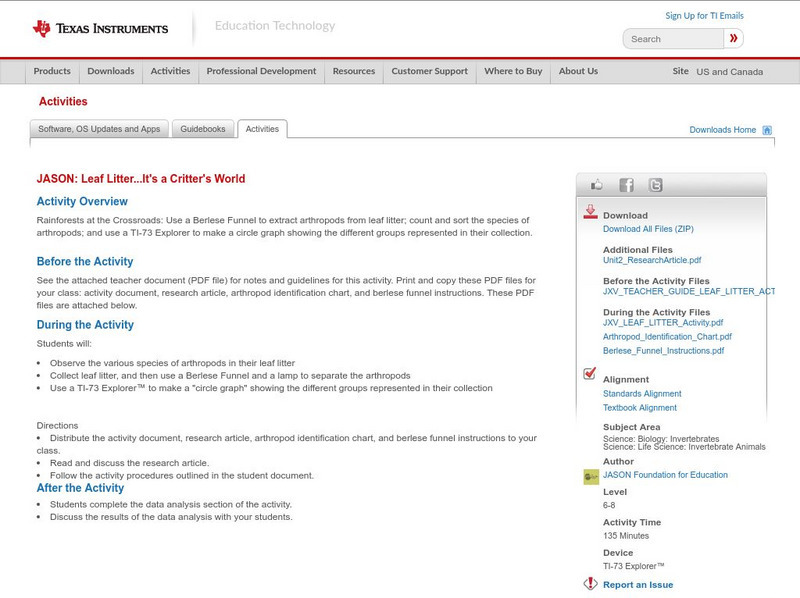
Texas Instruments: Jason: Leaf Litter, It's a Critter's World
Rainforests at the Crossroads: Use a Berlese Funnel to extract arthropods from leaf litter; count and sort the species of arthropods; and use a TI-73 Explorer to make a circle graph showing the different groups represented in their...
Texas Instruments
Texas Instruments: Conic Equations
This Learn Check file is a review of writing conic sections given the graph of a conic section. Students are asked to use the graphs to write the equations for a ellipse, circle, parabola, and hyperbola.
Texas Instruments
Texas Instruments: Exploring Geometric Probability Using Ti Navigator
In this activity students will contribute a set of random points to a graph of a circle of radius 1 inscribed in a square. They will estimate the area of the circle using geometric probability.
Texas Instruments
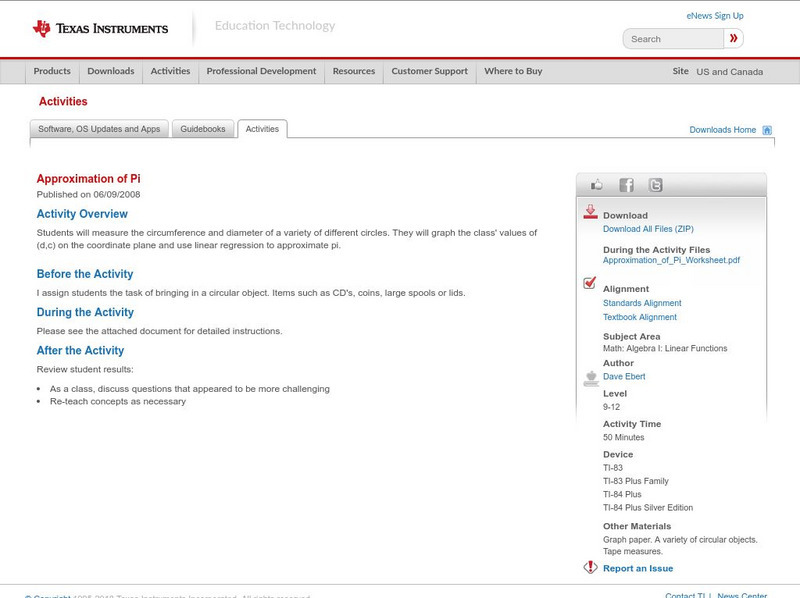
Texas Instruments: Approximation of Pi
Students will measure the circumference and diameter of a variety of different circles. They will graph the class' values of (d,c) on the coordinate plane and use linear regression to approximate pi.
Other
Laus Dnet: Grade 5 Excel Lesson Plan
In this online lesson, students will survey students in their school to determine their favorite type of hand-held ice cream. Before performing the survey, students will make predictions about which ice creams they think will be the...


![Top Science: Pi Graph [Pdf] Unknown Type Top Science: Pi Graph [Pdf] Unknown Type](https://d15y2dacu3jp90.cloudfront.net/images/attachment_defaults/resource/large/FPO-knovation.png)


