Curated OER
Pie Chart
In this literacy worksheet, students use the created resources for further progress towards knowledge. The sheet is a teacher's guide for creating student resources.
Yummy Math
US Holiday Candy Sales
Candy is a big business! Calculate the amount of money consumers spent on major holidays—Easter, Halloween, Christmas, Hanukkah, and Valentine's Day—based on the total amount of candy sales from 2011 and the percentage of each holiday's...
Special Olympics
Special Olympics Volleyball Coaching Guide: Teaching Volleyball Skills
From warm-up routines and stretches to skill progressions and passing drills, this is an absolute must-have resource for coaches teaching volleyball to a group of learners with diverse needs and skills.
Center for Innovation in Mathematics Teaching
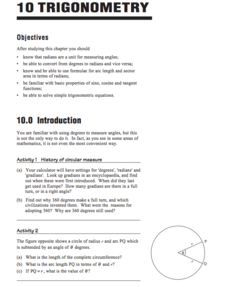
Trigonometry
This unit covers the basic trigonometry including understanding radians, how to convert between radians and degrees, the area of a circle subtended by an angle, basic properties and graphs of sine, cosine, tangent, and solving...
Curated OER
Multiple Intelligences Survey
In this multiple intelligences worksheet, students complete a survey asking them about different ways they like to learn. Students complete 24 questions. This should be a very enjoyable activity for students.
Geophysical Institute
Latitude and Longitude with Google Earth
Travel the world from the comfort of your classroom with a instructional activity that features Google Earth. High schoolers follow a series of steps to locate places all over the earth with sets of coordinates. Additionally, they...
Curated OER
World Oil Packet
In this oil consumption worksheet, students analyze the data about oil consumption and production in 3 graphs. Students then respond to 12 questions about the data.
Curated OER
Verbal and Algebraic Expressions
In this expressions worksheet, students solve and complete 30 various types of problems that include defining both verbal and algebraic expressions. First, they translate each verbal expression into an algebraic expression and vice...
Curated OER
1Word and Letter Match Puzzle
In this word and letter match worksheet, students match groups of 3 letters to words that contain each set. A reference web site is given for additional activities.
K12 Reader
What Is a Glyph?
After reading a short passage about glyphs, kids must follow the provided directions to create a star glyph.
Virginia Department of Education
Independent and Dependent Variables
Investigate the relationship between independent and dependent variables. Individuals begin by identifying independent and dependent variables from different problem situations. Then, using specific guidelines, they create posters...
Curated OER
Pond Theme Unit
For this pond theme worksheet students research facts on pond life. Students complete comprehension questions, crosswords, word search, and math puzzles. Students write a short report.
Curated OER
Integers - Graphical Representation
In this integers worksheet, 8th graders solve 21 various types of problems to include writing statements given as integers, writing a positive or negative integer for each point on a number line, and arranging integers in order from...
Curated OER
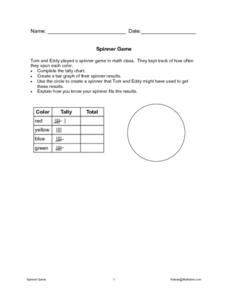
Math Spinner Game
In this math game activity, students complete a tally chart by filling in the "total" column of a graphic organizer. Students then create a spinner that might have been used to get the results shown and then explain how they know the...
Government of Alberta
Learn Alberta: Math Interactives: Exploring Data Display and Graphs
This multimedia Learn Alberta math resource focuses on graphing data. In the video portion, students will see how math is involved in the display of merchandise in stores. The accompanying interactive component provides an exploration...
Government of Alberta
Learn Alberta: Math Interactives: Exploring Election Data
Using actual Alberta provincial election results, students have the opportunity to interpret election data using a variety of graph types. Pictographs, line graphs, bar graphs, circle graphs, and data tables are covered in this...
TOPS Learning Systems
Top Science: Pi Graph [Pdf]
An activity where students explore and graph the relationship between the diameter and the circumference of a circle.


![Top Science: Pi Graph [Pdf] Unknown Type Top Science: Pi Graph [Pdf] Unknown Type](https://d15y2dacu3jp90.cloudfront.net/images/attachment_defaults/resource/large/FPO-knovation.png)