Curated OER
Introduction to Graphs
Students poll classmates to gather information for a graph. They identify three types of graphs (bar, line, table). Students create each type of graph using data gathered from classmates.
Curated OER
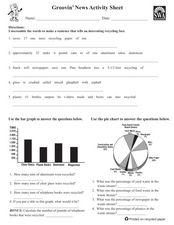
Groovin' News Activity Sheet
In these recycling worksheets, students complete several activities to learn about recycling. Students complete a word search, word scramble, bar graph, pie chart, research project, class project, and individual project for recycling.
Curated OER
Students Favorites
Students complete activities using a frequency table and construct a pie graph for the data. In this frequency table lesson, students complete a survey to find data for a frequency table. Students use the given link to make a pie graph...
Curated OER
Data Analysis Challenge
In this data analysis worksheet, young scholars work with a partner to collect information for a survey. The information is then compiled into a graph. Students must indicate their survey question, the target audience, predict the...
Jason Learning
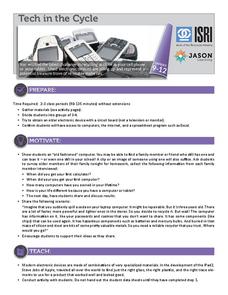
Tech in the Cycle
It might not be easy, but it is worth recycling electronics. Small groups determine the percentage of the materials that make up an iPad 2 and display the information in a circle graph. They then research the recycling process for...
Texas Instruments
Exploring Tangents
Explore the concept of tangent lines. In this tangent line lesson, learners graph a circle and two lines on their graphing calculator using Cabri Jr. High schoolers construct the lines so that they both intersect at a given point and are...
Curated OER
Cabri Jr. Inscribed Angles
Young scholars construct inscribed angles using Cabri Jr. They draw a circle on their graphing calculator, then construct an inscribed angle and measure its angle measures. Learners drag the inscribed angle around the circle. They make...
Curated OER
Graphing Fun
First graders analyze objects and make a graphing picture to analyze the data. In this graphing lesson, 1st graders complete an object graph assessment, a picture graph assessment, and a bar graph assessment to analyze their given objects.
Curated OER
Australian Settlers
Students interpret graphs and research events to identify links between events in the world and the arrival and plight of immigrant groups. They discuss the myths about immigration.
Curated OER
"Graph It"
Students work in teams to conduct short surveys of their classmates. They show their results using at least two different types of graphs.
Students separate into teams and are asked that each team to choose something that they are...
Curated OER
Creating Bar Graphs and Pie Graphs
Second graders observe a demonstration of the creation of a bar graph and a pie graph of their favorite colors. They gather information about various topics from their classmates, then organize the information, creating a bar and a pie...
Curated OER
Usage and Interpretation of Graphs
Young scholars review graphing and use processing skills to solve problems.
Curated OER
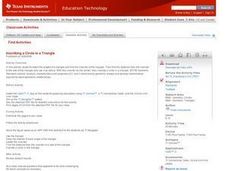
Inscribing a Circle in a Triangle
Pupils investigate inscribing a circle in a triangle. They use Cabri Jr. to draw a triangle, locate the incenter, and use the distance from the incenter to a side of the triangle to inscribe a circle. The dynamic nature of the geometry...
Curated OER
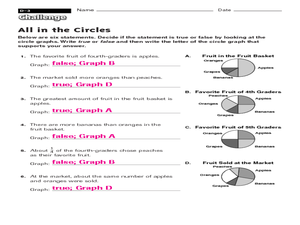
All in the Circles
In this circles worksheet, learners use 4 circle/pie chart graphs to answer a set of 6 questions. Answers are included on page 2.
Radford University
Marketing Mayhem: Advertising for Adolescents
You'll be sold on using the resource. Future consumers first conduct a sample survey on marketing strategies. They then consider how mass media influences their age groups and create presentations to display their findings.
Virginia Department of Education
Prokaryotes
Lead your biology class on a cell-sized adventure! Emerging scientists construct models of prokaryotes, then design an experiment to properly grow a bacterial culture. They conclude the activity by viewing the culture under a microscope....
Curated OER
Linear Inequalities in One and Two Variables: Rays and Half Planes
Define rays and half planes, including the concepts of boundary lines and prerequisite knowledge of coordinate planes. Given linear inequalities in one and two variables, your class will compare the differences. They will also graph...
Curated OER
Growing Circles
High schoolers identify the equation to represent a circle. In this algebra lesson, students review properties of conics and how they are related. they use a robot to create a visual of circles and their application to the real world.
Curated OER
The Unit Circle
Students solve problems using the unit circle. In this precalculus lesson, students identify angles using the properties of the unit circle. They observe the trigonometric graphs and sine, cosine and tangent.
Curated OER
Circular Motion
Students investigate circular motion in two different activities. In the first, students observe the path of a rolling marble on a paper plate. In the second, students play a game of catch using a tennis ball inside a plastic bag. ...
Curated OER
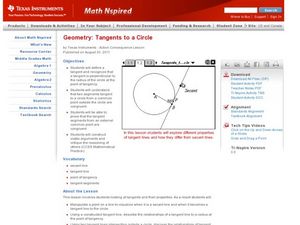
Tangents to a Circle
Students construct tangent lines. In this geometry lesson, students identify the point of tangency, secant and tangent lines. They graph the lines on the Ti and make observations.
Curated OER
Triangle and Circle Trigonometry
In this Pre-calculus/Trigonometry worksheet, students apply advanced triangle and circle trigonometry to solve application problems. The three page worksheet contains sixteen problems. Answers are not included.
Curated OER
3.14159265
Students discover the value of Pi. In this value of Pi lesson, students measure the circumference and diameter of various circles on their graphing calculator. Students find the ratio of the circumference to the diameter and plot the...
Curated OER
Excel temperature Graphs
Students gather data about the weather in Nome, Alaska. In this Nome Temperature lesson, students create an excel graph to explore the weather trends in Nome. Students will find the average weather and add a trend line to their graph.


