Curated OER
Activity Plan 3-4: Scrumptious Shapes
Students discover together that shapes are everywhere - even in the food we eat. In this early childhood math and art lesson, students read about shapes, identify foods that match geometric shapes, and create a class book.
National Security Agency
Partying with Proportions and Percents
Examine ratios and proportions in several real-world scenarios. Children will calculate unit rates, work with proportions and percentages as they plan a party, purchase produce, and take a tally. This lesson plan recommends five...
Curated OER
Name Fame
First graders learn the uniqueness of their names by reading the book, Chrysanthemum, and completing other integrated math counting and graphing activities.
Curated OER
Moving Out
Students determine their cost of living. In this determining their cost of living lesson, students think of ten necessary things they would need if they moved out of their parents house. Students research the cost of renting an...
Curated OER
Exploring Geometric Figures
Tenth graders explore mathematics by participating in hands-on daily activities. Learners identify a list of different shapes and classify them by shape, size, sides and vertices. They utilize tangrams and geometric pieces to gain an...
Curated OER
Fractions, Decimals, and Percents
Students connect different mathematical concepts. They create a circle graph. Students then create a question in which they collect data in order to convert fractions to decimals and decimals to percents.
Curated OER
Piece of Pie Chart
In this math worksheet, young scholars examine a pie graph which shows a student's homework over 2 hours. Students read the information, then use a pie chart template (divided into 24 parts) to make their own homework chart.
Oddrobo Software
King of Math Junior
Do your students have what it takes to be the king of math? Find out with this fun skills practice game that covers a wide range of topics from counting and basic operations to measurement and fractions.
CCSS Math Activities
Smarter Balanced Sample Items: High School Math – Claim 3
Communication is the key. A presentation provides 25 sample items for Claim 3, Communicating Reasoning, for the Smarter Balanced High School Math assessment. Items require pupils to answer the question and provide logical reasoning to...
Curated OER
ou are the Researcher!
Students conduct a census at school. They collect data, tally it, and create a frequency table. Students display their data in three different types of graphs. They write complete sentences describing the graph.
Curated OER
Analyzing Visual Symbols
Students analyze and identify visual symbols in everyday life and during a museum visit. In this visual symbol lesson, students study associated vocabulary such as analyze and interpret. They find and note attention getting symbols...
Curated OER
Bubble Gum Chemistry
Students explore the concept of graphing data. In this graphing data instructional activity, students determine the percentage of sugar in bubble gum. Students graph type of gum vs. sugar percentage. Students create a table of their data.
Curated OER
Opening the Case
Students participate in a class survey and then design an experiment and use graphs and statistics to assist them in solving a problem. They organize the results of the survey in a stem-and-leaf plot and find the range, median, mean, and...
EngageNY
Complex Numbers and Transformations
Your learners combine their knowledge of real and imaginary numbers and matrices in an activity containing thirty lessons, two assessments (mid-module and end module), and their corresponding rubrics. Centered on complex numbers and...
K12 Reader
Displaying Data
It's important to learn how to display data to make the information easier for people to understand. A reading activity prompts kids to use context clues to answer five comprehension questions after reading several paragraphs about...
Illustrative Mathematics
Velocity vs. Distance
At the end of this activity, your number crunchers will have a better understanding as to how to describe graphs of velocity versus time and distance versus time. It is easy for learners to misinterpret graphs of velocity, so have them...
It's About Time
Newton's Law of Universal Gravitation
While science is looking for correct explanations, pseudoscience often fills in the blanks. Pupils explore the relationship between light distance and intensity and graph their data. Then they compare their data to Newton's Law of...
Houghton Mifflin Harcourt
Unit 5 Math Vocabulary Cards (Grade 4)
A set of 49 cards can enhance fourth graders' math vocabulary. It provides a pair of cards on each sheet, one with the word printed in bold text, and the other with the definition of the word. Topics of the cards include mostly...
Texas State Energy Conservation Office
Investigation: Water Wheel
Middle school scientists construct a working water wheel from an aluminum pie pan. Because of the sharp edges on the cut aluminum, this activity is for mature learners only. You could have your class compete to see whose wheel can lift...
Curated OER
Investigation Designing a Patchwork Quilt
Fourth graders practice calculating area by creating a classroom quilt. Students are given a 6x6 inch square material they design based on a classroom theme. A sample of the class quilt is created using graph paper so students may...
Curated OER
Math Games for Skills and Concepts
A 27-page packet full of math games and activities builds on algebra, measurement, geometry, fractional, and graphing skills. Young mathematicians participate in math games collaboratively, promoting teamwork and skills practice.
Shodor Education Foundation
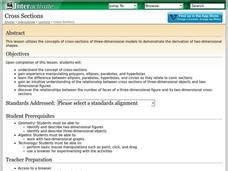
Cross Sections
Use this activity on cross-sections of three-dimensional shapes in your math class to work on algebra or geometry Common Core standards. The instructional activity includes a list of relevent terminology, and a step-by-step process to...
PBS
U.S. Agricultural Subsidies and Nutrition
Most young people don't spend a lot of time thinking about why some foods cost less than others. This resource uses clips from the documentary, Food, Inc. to explore the impact of agricultural subsidies on nutrition, health, and the...
American Statistical Association
Exploring Geometric Probabilities with Buffon’s Coin Problem
Scholars create and perform experiments attempting to answer Buffon's Coin problem. They discover the relationships between geometry and probability, empirical and theoretical probabilities, and area of a circle and square.


