Curated OER
Problem-Solving Application: Make a Circle Graph
In this circle graphs worksheet, students analyze a data table about the activities in a day. Students then use this data to make a circle graph. Students answer 6 questions about the graph.
Math Mammoth
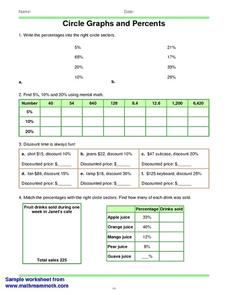
Circles Graphs and Percents
In this percent instructional activity, students read and interpret circle graphs. They determine discounts, and match percentages with circle sectors. This one-page instructional activity contains approximately 30 problems.
Curated OER
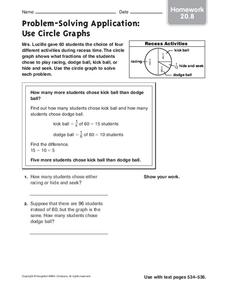
Problem-Solving Application: Use Circle Graphs
In this problem solving worksheet, students analyze the information in a circle graph about recess activities. Students use this graph to solve 2 application problems.
Curated OER
The Circle Graph
In this circle graph worksheet, students complete problems involving many circle graphs including a compass rose, degrees, and more. Students complete 7 activities.
Virginia Department of Education
Graphs
Examine different types of graphs as a means for analyzing data. Math scholars identify the type of graph from a series of data displays and then develop questions to match each one. Then, given a scatter plot of height versus age data,...
Curated OER
Circle Graph Activity
In this circle graph activity, learners ask 16 people what their favorite vegetable are, then create a circle graph to represent the information.
Virginia Department of Education
Circles in the Coordinate Plane
Make the connection between the distance formula and the equation of a circle. The teacher presents a lesson on how to use the distance formula to derive the equation of the circle. Pupils transform circles on the coordinate plane and...
West Contra Costa Unified School District
Solving Equations Using Balance Scale, Decomposition, and Graphing
There's more than one way to solve an equation — three, actually. Scholars learn how to solve simple linear equations in one variable using three different methods, which include using balance scales, using decomposition (e.g., turning...
Curated OER
Organizing Data
In this organizing data worksheet, 7th graders solve seven different types of problems related to data. They first identify the type of data as categorical, discrete or continuous from the information given. Then, students use Excel to...
Kelly's Kindergarten
June Daily Activities
This is an absolute must-have resource for early elementary teachers! Here you'll find a collection of activities and worksheets for each day of the month of June, with topics ranging from ordering numbers on a calendar or identifying...
Virginia Department of Education
Scatterplots
Math is all fun and games with this activity! Learners use an activity designed around hula hoops to collect data. They create scatter plots with their data and then analyze the graphs for correlation.
Math Moves U
Collecting and Working with Data
Add to your collection of math resources with this extensive series of data analysis worksheets. Whether your teaching how to use frequency tables and tally charts to collect and organize data, or introducing young mathematicians to pie...
Curated OER
Circles and Parabolas
In this circles and parabolas worksheet, students follow directions to draw parabolas. They fold paper to represent a parabola. Students also use straight lines to create a circle. This one page worksheet contains three multi-step...
Curated OER
Let's Graph It! Pre-Test
In this graphing worksheet, students complete a set of 10 multiple choice questions, clicking on a link to see correct answers or print the page.
University of California
Seasons Lab Book
Unlock the mystery behind seasonal change with a collection of worksheets and activities. Whether they are drawing pictures of Earth's orbit around the sun or graphing the temperature and daylight hours of different locations from around...
Curated OER
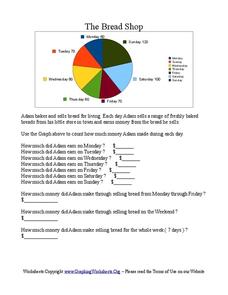
The Bread Shop
In this pie chart worksheet, learners use the pie chart graph to count the money Adam made in the Bread Shop. Students complete 10 questions.
Curated OER
Family Activity: Bar Graphs and Line Graphs
In this math worksheet, students work at home with a family member on a graphing activity. Students count the number of cans, glass jars, boxes and bags in the pantry. Students make a bar and a line graph to represent the data.
Curated OER
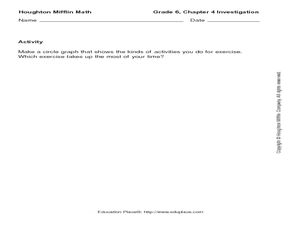
Making an Exercise Graph
In this making an exercise graph activity, 6th graders draw a circle graph that shows the kinds of activities they do for exercise.
Curated OER
Fill in the Graphs
In this graphing information activity worksheet, students use the 6 provided clues to appropriately fill in the blanks in a pie chart.
Virginia Department of Education
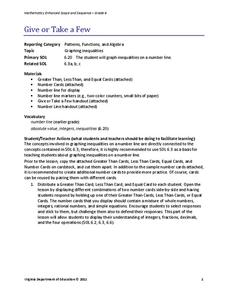
Give or Take a Few
Young mathematicians extend their knowledge of rational numbers on a number line to graph inequalities by first using number cards to compare rational numbers. They finish by using similar reasoning to graph inequalities on a number line.
Yummy Math
A Cardioid for Valentine’s Day
It's Valentine's Day in geometry class! Celebrate the day of love with a heart-themed activity in which young mathematicians create a cardioid on polar graph paper.
Virginia Department of Education
Curve of Best Fit
Which function models the data best? Pupils work through several activities to model data with a variety of functions. Individuals begin by reviewing the shapes of the functions and finding functions that will fit plotted data points. By...
Common Core Sheets
Determining Coordinates: Reading Positive & Negative Coordinates
For kids who have a hard time with graphing, a grid with coordinates can look like an unsolvable puzzle. A series of worksheets uses symbols and shapes like hearts, stars, and letters to help kids find the correct coordinates.
Barnstable Public Schools
Math Relay Races
A plethora of activities make up a cross curricular choice page filled with math games—relay races, dice, and crossword puzzles—a survey challenge equipped with data organization, graphing, a quicksand recipe, Hula-Hoop activity to...


