Curated OER
Circling Around the CEENBoT Way!
Students investigate the forces present in a rotating body. For this physics lesson, students calculate centripetal force using a mathematical equation. They answer a quiz and writing prompt at the end of the lesson.
Curated OER
Electric Field Mapping in 3D
Students create a 3D vector field map of an electric field. In this physics lesson, students measure the voltage inside an aquarium with water. They present their findings and map to class..
Curated OER
A Statistical Look at Jewish History
Students complete their examination over the Jewish Diaspora. Using population figures, they discover the importance of percentages in exploring trends. They use their own ethnic group and determine how it is represented in the United...
Curated OER
Algebra 2/Trigonometry Regents Exam
Young scholars review for the Regents Exam. In this math activity, students review core concept for the Regents exam by working a variety of problems. A printable worksheet is provided.
Curated OER
The Nutrients Public Transportation System
Students investigate the human circulatory system by experimenting with hoses. In this human body lesson, students create a system of hoses simulating the circulatory system which they utilize to pass objects through. Students discuss...
Curated OER
The Ice Cream Shop
Second graders read books about ice cream and plan an ice cream sundae party for the class. They research ingredients and determine how much the party cost each student. They hold a mock opening for an ice cream store and have their party.
Curated OER
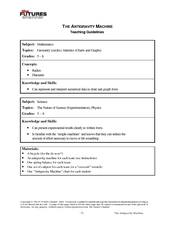
The Anti-Gravity Machine
Students examine physics by completing a bicycle experiment in class. In this gravity lesson, students measure the characteristics of different bicycles and compare their different race times. Students utilize a shoebox, pencil, tape,...
Curated OER
We Are Having a Party! Part II
Second graders, in groups, participate in a four-station rotation model to solve problems. They use coins and dice for stations one, two, and three.
Curated OER
Investigation of Timbre
Students design an experiment to analyze the timbre of different instruments. In this physics lesson, students analyze the missing quality in sound. They discuss their results in class.
Curated OER
Do You See What I See?
Students observe and describe different objects seen under a microscope and compare the individual perspectives of what was seen.
National Council of Teachers of Mathematics
Nctm: Illuminations: Circle Grapher
Use this tool to graph data sets in a circle graph. You can input your own data or alter a pre-made data set.
Beacon Learning Center
Beacon Learning Center: All That Data
Students analyze data by finding the mean, median, mode, and range of a set of numbers. Line plots, bar graphs, and circle graphs are also included in this lesson.
Alabama Learning Exchange
Alex: Get on Your Mark, Get Set, Go!
In collaborative/cooperative groups, students will review basic vocabulary and concepts for data and statistics. Students will create, collect, display, and interpret data in the form of frequency tables, bar graphs and circle graphs.
Can Teach
Can Teach: Math Centers
This page offers a variety of math center ideas for general math and geometry. Instructions on setting up the center are not provided for most ideas, however, those lacking instructions are pretty self-evident.
Math Is Fun
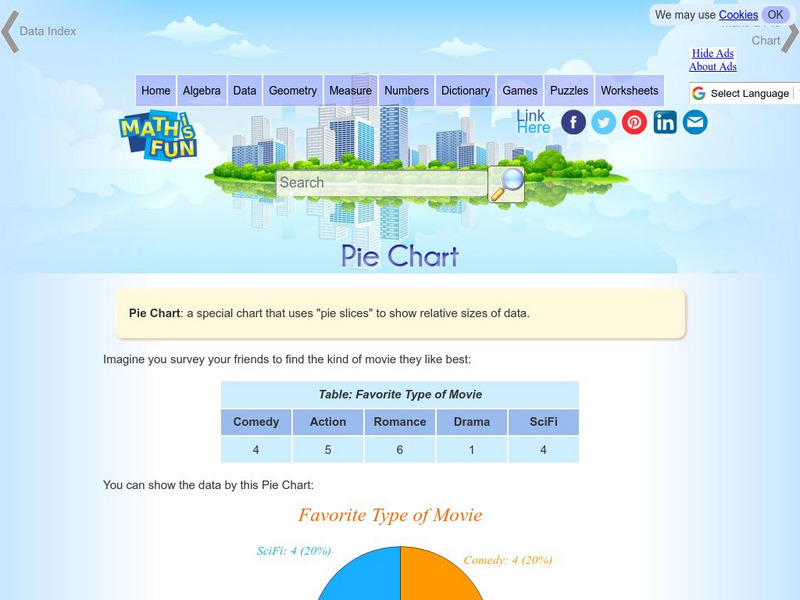
Math Is Fun: Pie Chart
Explains, with examples, what a pie chart is and how to make one. Includes a set of practice questions.


