Curated OER
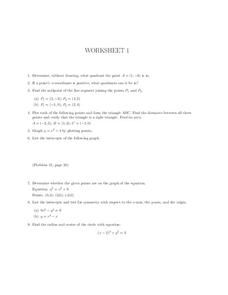
Worksheet 1, Coordinate Graphing
In this algebra worksheet, students determine the quadrant a given point is in. They find the midpoints of two line segments. Students plot points to form a triangle and find the distance between points. Students find the area of the...
Curated OER
Hexagoning the Circle
Students explore similarity to see that the area of a circle should be a constant times the square of its radius. Students create a hexagon. Students share their designs with the class.
Curated OER
Graphing Grazy Crayons
Children create crazy crayons they made to sort and construct a floor bar graph. Then, using technology resources, they make a simple bar graph to compare the top four colors produced. Students will then interpret the printed graph by...
Curated OER
Discovering Pi
Students develop a formula that describes the functional relationship of the circumference of a circle to its diameter. Working with a partner, they measure the diameter and circumference of circular objects in order to discover the...
Math Worksheet Center
Linear Quadratic Systems
For this linear quadratic system worksheet, students explore a system with a linear and a quadratic equation. With the given equations, students graph the parabola. They identify the axis of symmetry, the slope, points of intersection,...
Curated OER
Conic Sections
In this conic sections worksheet, students solve and complete 8 different problems identifying various types of conic sections. First, they write each equation given in standard form. Then, students determine whether the graph of each of...
Curated OER
Finding the Basal Area of a Forest Plot to Determine Stocking Levels
Learners use graphs and plots to measure the basal area and stocking levels. In this graphing instructional activity students work in the field the use their data to help them complete a lab activity.
Curated OER
Sizing Pumpkins
Fifth graders study the sizes of pumpkins. They measure and record the diameters of pumpkins. They create five subtraction problems and solve them. They weigh their pumpkins, record the data and select two pumpkins to make a graph of...
Curated OER
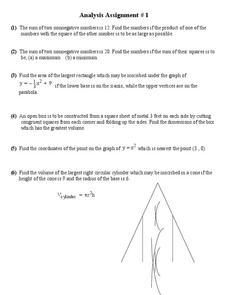
Area and Volume
In this area and volume activity, 10th graders solve and complete 6 different types of problems. First, they find the numbers if the product of one of the numbers with the square of the other number is to be as large as possible. Then,...
Curated OER
Cruising the Internet
Students identify the parts of an engine using a graph. In this statistics lesson, students make a graph from their collected data. They calculate the volume of a cylinder using a line of regression and a scatter plot.
Curated OER
Parabolas
In this parabolas activity, 10th graders solve and draw 10 different problems with figures related to various parabolas. First, they determine the vertex, focus, and the directrix in each equation. Then, students draw the parabola on a...
Curated OER
Parabolas
In this parabolas activity, 10th graders solve and graph 10 different problems that include various types of parabolas. First, they determine the vertex and the y-intercept for each problem given the information. Then, students write the...
Curated OER
Levers in the Body: They Are Not What You Might Think!
Students investigate lever systems in the human body and compare arm anatomy to model. In this human levers lesson students graph and analyze their results.
Curated OER
Toy Dissection Graph
Students explore simple machines and how they are made. They examine the parts of the simple machine and collect information about its parts. Using Excel, students create circle and bar graphs from the collected data.
Curated OER
Time Management: Piece of Pie
Students examine their own lives and how well they manage their time outside of school. In this this time management lesson, students discover the amount of time they spend on other activities, and create a pie chart with that...
Curated OER
Pi Day: The Other Math Holiday!
Happy Pi Day! This collection of games, experiments, and activities leads participants through an exploration of the many aspects and attributes of that mysterious quantity, pi. Activities range from using statistical experimentation to...
Curated OER
Matrix Madness!!
Perform operations to add, subtract, multiply and divide matrices. Then solve problems with vectors using matrices. A three day activity: Matrix Madness, Mystical Matrices, and Decode the Encode. The last activity has prizes that the...
Mt. San Antonio Collage
Quiz 1: Types of Functions
Sometimes the best things are already done for you! Here is a six-problem quiz that has a variety of problems ranging from solving quadratic equations to interpreting a function. The piece-de-resistance is the worked out answer key in...
Marshall Cavendish International
Coordinate Plane Treasure Hunt
Similar to the game Battleship®, partners try and determine where the opponent buried their treasures on the hidden coordinate plane. Two types of planes are provided, one with only quadrant one and one with all four for a higher...
West Contra Costa Unified School District
Standard Form of Conics
Looking for a complete go-to guide for the standard form of conics? This five-page packet does a nice job of connecting conics to prior knowledge of functions and transformations. Adapt the resource as Algebra II lesson plan notes, or...
Lane Community College
Review Sheets: Geometry
Full of problems with polygons, angles, lines, and triangles, your learners get a multi-page packet that provides all they need to know. It contains many of the standard problem types as well as some more challenging questions.
Curated OER
Quarter Sorter
Graphing and sorting are such important skills for young learners to understand. Here, they will be given quarters to examine, they must come up with a sorting rule by which they will use to sort the quarters. They will sort their...
Curated OER
Worksheet 7 - Asymptote
In this asymptote worksheet, students compute limits, graph vertical asymptotes, and find the slope of the secant line. This one-page worksheet contains six multi-step worksheets.
Curated OER
Worksheet 5 - Squeeze Theorem
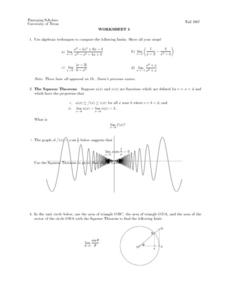
In this Squeeze Theorem worksheet, students compute limits, identify a graph that represents the Squeeze Theorem, and graph given functions. This two-page worksheet contains seven multi-step problems.
Other popular searches
- Percent Circle Graph
- Circle Graph Worksheet
- Circle Graph Template
- Interpreting Circle Graphs
- Circle Graph Protractor
- Circle Graph Activity
- Reading Circle Graphs
- Circle Graphs Pie Charts
- Circle Graph Central Angle
- Bar and Circle Graphs
- Circle Graph in Excel
- Family Budget Circle Graph


