Curated OER
Paying for Crime
Students participate in activties examining ratios and proportions. They use graphs to interpret data showing the government's budget for prisons. They present what they have learned to the class.
Curated OER
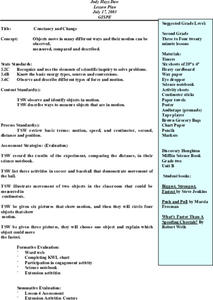
Constancy and Change
Second graders investigate how objects can move in different ways. They move in different ways across the room and develop a class list of movement words. Students also conduct a measuring motion experiment, create a bar graph for the...
Curated OER
Name That Tune: Matching Musical Tones Through Waveform Analysis
Pupils detect the waveform of musical notes to determine the code for the "safe" in this forensics simulation lesson. They use a microphone and tuning forks along with Vernier EasyData on their graphing calculator to analyze five musical...
Curated OER
Harmonic Motion
In this harmonic motion activity, students read about repetitive motion, the parts of harmonic motion, and graphing harmonic motion. Students then complete 5 matching and 20 fill in the blank questions.
Curated OER
Linear Motion in Class Test Review
In this linear motion worksheet, students answer 21 questions about acceleration, velocity, position and time. Students interpret graphs of position vs. time, velocity vs. time and acceleration vs. time. They calculate speed of objects,...
Curated OER
How to Build an Electric Motor
Sixth graders build a working motor. In this lesson on motors, 6th graders use an inquiry method of learning to discover how to create a working electric motor with the supplies given to them. The teacher will guide them as needed....
Curated OER
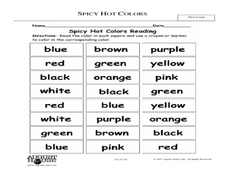
Spicy, Hot Colors
Students demonstrate an understanding of colors. In this visual arts lesson, students read the text Hot, Spicy Colors and name their favorite colors. Students complete a bar graph to show the data. Students discuss how each color can...
Curated OER
Equations of Lines Perpendicular and Parallel
In this algebra worksheet, students solve linear equations using one and two steps. They solve systems of equations using substitution and elimination with graphing. There are links for ready made tests and quizzes.
Curated OER
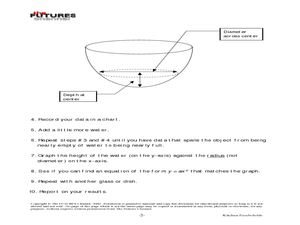
Kitchen Paraboloids
Students solve quadratic equations and identify functions. In this algebra lesson, students graph parabolas and identify properties describing the shape of the parabola. They find the vertex and rewrite the equation in standard form.
Curated OER
Getting to Know You
Students converse with each other while playing a game in order to discover things that are alike and things that are different about themselves. The students gather data about themselves, organize and display data on the graph, and...
Curated OER
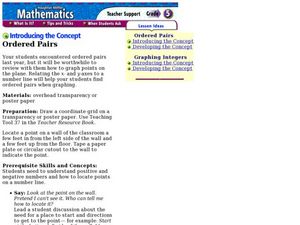
Introducing the Concept: Ordered Pairs
Students review ordered pairs. In this graphing lesson, students review ordered pairs with the teacher. This lesson includes a brief teacher script to help guide the students in understanding.
Curated OER
Pie Charts
The teacher conducts a survey of each student's favorite color. The teacher then creates a pie chart identifying the information gathered. The students display mastery by creating their own pie chart displaying the same information.
Curated OER
Data Analysis
Students double check their data collections of Top 20 singles that they've been collecting for several days. Types of data is reviewed in detail and a variety of questions are asked for retention factors of mastery. They draw a tally...
Curated OER
Pie Chart
In this literacy worksheet, students use the created resources for further progress towards knowledge. The sheet is a teacher's guide for creating student resources.
Curated OER
Pie Charts
In this math activity, students complete the work in order to chart the data into the pie graph. The picture is used for statistical analysis.
Curated OER
My Science Box
Students investigate snails and their physical and behavioral characteristics. In this investigative lesson students create a pie chart to show the results of their findings.
Curated OER
Fractions: pie graphs, numbers, and bars
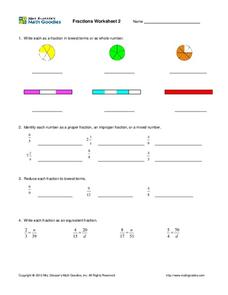
In this fraction worksheet, middle schoolers complete fraction problems containing pie graphs, numbers, bars, proper fractions, lowest terms, and more. Students complete 19 problems.
Curated OER
Colours of the Church Year
For this Colours of the Church Year worksheet, students use the chart 'Colours of the Church Year' to complete the pie-chart with the Church seasons and fill in the missing words.
Curated OER
Discovering Pi
Sixth graders measure circumference and diameter to the nearest eighth of an inch, record measurements on a spreadsheet, and use the internet to complete a "scavenger hunt" of facts concerning pi.
Curated OER
Grids
This fun presentation includes instructions for a grid game, where the child must follow directions to uncover the hidden treasure. They make Mr. Smiley move up, down, right, and left on the grid until he's reached the designated...
Mathematics Vision Project
Module 6: Congruence, Construction, and Proof
Trace the links between a variety of math concepts in this far-reaching unit. Ideas that seem very different on the outset (like the distance formula and rigid transformations) come together in very natural and logical ways. This unit...
Florida Center for Reading Research
Fluency: Connected Text, Repeated Timed Reading
There are many different ways to build accuracy and fluency when reading. This exercise employs repetition and timed drills to get the job done. Learners time each other as they read a passage, recording each other's time and accuracy.
Virginia Department of Education
Curve of Best Fit
Which function models the data best? Pupils work through several activities to model data with a variety of functions. Individuals begin by reviewing the shapes of the functions and finding functions that will fit plotted data points. By...
K12 Reader
St. Patrick’s Day Word Search
Get in the St. Patrick's Day spirit with a 12-word, word search puzzle!
Other popular searches
- Percent Circle Graph
- Circle Graph Worksheet
- Circle Graph Template
- Interpreting Circle Graphs
- Circle Graph Protractor
- Circle Graph Activity
- Reading Circle Graphs
- Circle Graphs Pie Charts
- Circle Graph Central Angle
- Bar and Circle Graphs
- Circle Graph in Excel
- Family Budget Circle Graph


