Curated OER
Coin Probability
Fourth graders, in pairs, receive three different types of coin bags. They pick coins out of the bag and tally what was picked fifteen times. They do it with all three bags for three separate tallies.
Curated OER
Personal Budgeting Project
Young scholars create an Excel spreadsheet of a personal budget by estimating their possible income and monthly expenses from a worksheet. They group together to create a family unit and use the personal budget sheets to plan a family...
Curated OER
Parabola
In this parabolas worksheet, 10th graders solve and graph 12 different problems related to various types of parabolas. First, they determine the vertex and the y-intercept based on the graph illustrated for each. Then, students write a...
Curated OER
Binary Operations
In this binary operations worksheet, 7th graders solve and complete 12 different problems that include various types of binary operations. First, they determine if the operation used is commutative. Then, students name the identity...
Other
Percentage Fraction Decimal Grid
Divide a square or circle up into a number of parts. The slices or rectangles can be painted various colors and these colors then represented as either decimals, fractions or percentages.
Texas Instruments
Texas Instruments: Grandparents and Special Friends Day
This lesson was designed for our Grandparents and Special Friends day. It can be used for any visitation day, or an open house. The lesson is designed to review percent of a whole and the sector of the circle representing the percentage....
E-learning for Kids
E Learning for Kids: Math: Group of Pyramids: Fractions and Graphs
On this interactive website, students practice various math skills using a real-life scenario at the pyramids. Those skills include showing percentages as fractions and decimals and interpreting data in a sector graph.
ClassFlow
Class Flow: Reading Circle Graphs
[Free Registration/Login Required] Students are asked to figure out the size of the shaded portions of a circle graph. They then complete a chart showing the fraction, decimal, and percentage equivalents.
Beacon Learning Center
Beacon Learning Center: Chances Are
Students explore the likelihood of events using circle graphs and percentages in this interactive web lesson.
Alabama Learning Exchange
Alex: Great Golly Graphs
This lesson plan asks students to create a survey project including graphs, questions, tables, and data analysis. It gives an assessment and ideas for remediation and extension as well as ways to manage behavior problems and reluctant...
Texas Instruments
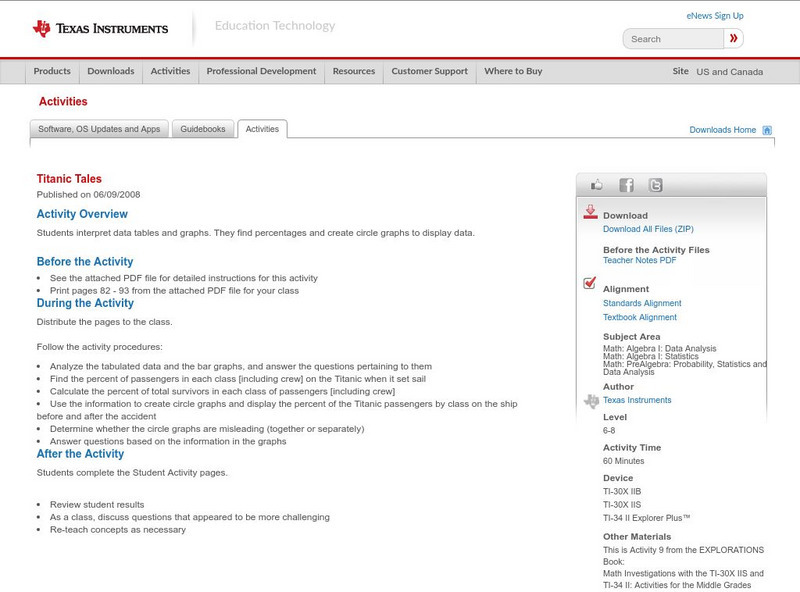
Texas Instruments: Titanic Tales
In this activity, students interpret data tables and graphs. They find percentages, and create circle graphs to display data.
US Department of Education
Nces: How to Create a Pie Chart
Resource from the National Center for Education Statistics provides tools and steps for creating printable pie charts online. Fill in the information, click the necessary buttons, and you have created a pie chart!
Curated OER
Etc: Maps Etc: The United States Population and Railroad Network, 1901
A map from 1901 of the United States showing population density, railroad lines, state capitals, and census centers of population at the time. The red figures indicate the mean population density per square mile for each state according...


