Curated OER
Forecasting Weather
In this weather instructional activity, students review the different things a meteorologist studies and how they collect weather data. Students compare weather watch and weather warning. This instructional activity has 10 matching and 3...
Curated OER
Highs and Lows
Students use email to chart weather patterns and then graph their findings. In this weather patterns lesson, students chart their weather for a week at the school. Students then use email to find temperatures at a variety of locations....
Curated OER
Meteorological Predictions
Students make a link between prediction and hypothesis in math and science. Based on data collected over one week, students evaluate the predictions of local weather forecasters, compare the predicted outcomes to the actual weather...
Wild BC
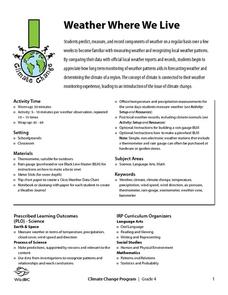
Weather Where We Live
Over a span of two weeks or more, mini meteorologists record weather-related measurements. What makes this particular resource different from others covering similar activities are the thorough details for the teacher and printables for...
Discovery Education
How's the Weather?
Young meteorologists explore different aspects of the weather while learning about measurement devices. They build instruments and then set up a weather station outside and measure temperature, humidity, air pressure, wind speed, and...
Curated OER
Weather Watchers
Learners identify basic weather instruments and how they are used to record weather data. Students define several vocabulary terms as stated in instructional activity. Learners use basic instruments to record weather data in their area....
NASA
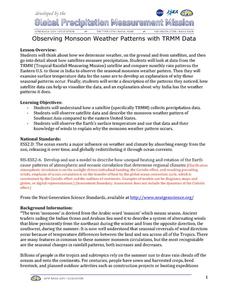
Observing Monsoon Weather Patterns with TRMM Data
Follow a fabulous slide show on how monsoons form and how satellite technology is being used to observe the phenomena, explaining why they occur. Afterward, visit the TRMM (Tropical Rainfall Measuring Mission) website to access actual...
Curated OER
Hurricane Frequency and Intensity
Students examine hurricanes. In this web-based meteorology lesson, students study the relationship between ocean temperature and hurricane intensity. They differentiate between intensity and frequency of hurricanes.
Curated OER
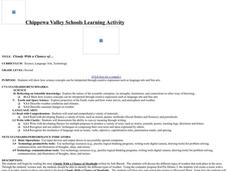
Cloudy With a Chance of...
Second graders will write a story. In this writing and meteorology activity, 2nd graders read the story Cloudy With a Chance of Meatballs, then use KidPix to create a weather picture. The picture is imported into a word processor and the...
Curated OER
"Weather Watch"
Students investigate components of weather and the climate in areas around the country. They analyze data from the University of Michigan weather website, complete a weather watch worksheet, and graph weather data.
Curated OER
Global Warming
This contains a writing prompt about global warming that could be adapted in a number of ways. The resource provides some information about global warming and possible effects. Learners explore the enhanced greenhouse effect and the...
Curated OER
Weather Forecasting
Students examine cold, warm, and stationary fronts. They also examine the roles of relative humidity and the way air masses move. They are to create forecasts based on the information they collect. Tapes are shared with the class.
NASA
The Case of the Wacky Water Cycle
Join the tree house detectives in learning about the processes of the water cycle, water conservation, water treatment, and water as a limited resource.
Curated OER
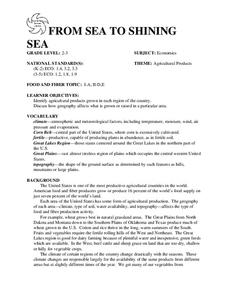
FROM SEA TO SHINING SEA
Identify agricultural products grown in each region of the country.
Discuss how geography affects what is grown or raised in a particular area.1. Hand out a copy of the two activity sheets "Food From Sea to Shining Sea" to each student....
Curated OER
Hurricanes
Young scholars listen to a transcript of an interview about an upswing in hurricanes with Stanley Goldenberg, a researcher with the National Oceanographic and Atmospheric Administration. students participate in a series of discussion...
Curated OER
Activities to Enhance STEDII Data
Students develop an understanding of related weather processes such as wind, cloud cover, and temperature using STEDII data and instrumentation. In addition, they integrate mathematical calculations to produce a forecast map.
Curated OER
Water Supply
Fourth graders explore weather patterns by completing an Internet project. In this water cycle lesson plan, 4th graders read assigned text including a Magic School Bus book about precipitation and water. Students complete a water science...
Curated OER
Comparing Local, National, International Biomes
Students calculate averages of climate sets of data. In this ecology instructional activity, students analyze data to determine identity of a biome and collect meteorological data to understand process. Students also compare data sets.
Curated OER
The Blizzard of 1993
Students read and interpret the information from a barograph from a major winter storm. This task assesses students' abilities to interpret and analyze graphs, construct data tables and graphs, generalize, infer, apply knowledge of...
Curated OER
Name that Wind
Students study wind and the direction terms related to wind. In this meteorology lesson, students learn about the wind directions by completing a wind direction activity where kids locate cones marked with the specific wind directions....
Curated OER
Currently Warm
Seventh graders investigate how ocean currents affect climate. In this earth science lesson, 7th graders draw and label the current in their assigned ocean. They discuss how currents from the poles differ from the equator.
Curated OER
Earth Science - Weather
Students build an understanding of the dynamics and composition of the atmosphere and its local and global processes influencing climate and air quality. They analyze air masses and the life cycle of weather systems.
Curated OER
The Beaufort Scale: A Local Model
Students study the Beaufort Scale and use it to study wind in their community. In this wind study lesson, students watch a DVD about climate change and learn about the Beaufort Scale. Students complete a worksheet for the topic.
Curated OER
Global Warming Statistics
Students research real-time and historic temperature data of U.S. and world locations, and analyze the data using mean, median, and mode averages. They graph the data and draw conclusions by analyzing the data. A spreadsheet is used to...


