Curated OER
Weather Wise
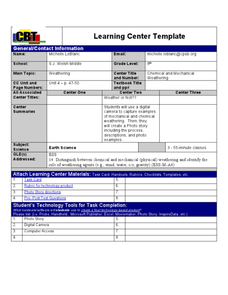
Students investigate weather and how to forecast it. They discuss the three types of clouds and the kind of weather they bring. After setting up a database, they reearch weather-related websites to check cloud conditions and weather...
Curated OER
Technology Integration Project Weather Unit Plan
High schoolers use a variety of technology-assisted weather observation tools to observe and record local weather. They identify, measure and record weather conditions, summarize types of clouds and make graphs of their observations....
Curated OER
Is Grandpa Right, Were Winters Colder When He Was a Boy?
Students compare current weather data to historic data to see if there is a temperature change. For this weather lesson students complete a lab activity and determine average changes in temperature, precipitation and cloud cover.
Curated OER
Think GREEN - Utilizing Renewable Solar Energy
Learners use data to find the best renewable energy potential. In this solar energy lesson students import data into Excel and explain how solar energy is beneficial.
Chicago Botanic Garden
Climate Change Around the World
Look at climate change around the world using graphical representations and a hands-on learning simulation specified to particular cities around the world. Using an interactive website, young scientists follow the provided directions to...
Curated OER
How Much Water is Available in the Atmosphere for Precipitation?
Students explore the relationship between the amount of water in the atmosphere available for precipitation and the actual precipitation observed by satellite. They examine seasonal changes in precipitation. They practice using Internet...
Institute for Humane Education
I've Been Branded!
How many pairs of Nikes® or Apple® products are in the average American home? What makes someone buy one particular type of laundry detergent over another? Scholars grapple with these questions as they develop a list of brands they use...
West Contra Costa Unified School District
Correlation and Line of Best Fit
Computers are useful for more than just surfing the Internet. Pupils first investigate scatter plots and estimate correlation coefficients. Next, they use Microsoft Excel to create scatter plots and determine correlation coefficients and...
Curated OER
Is Portland, Oregon Experiencing Global Warming?
Students use data to determine if the climate in Portland has changed over the years. In this weather lesson students complete line graphs and study long wave radiation.
Curated OER
Art in the Sky
First graders become familiar with four types of clouds by experimenting with cameras and exploring the web. They observe illustrators' renderings of clouds and draw their own representation of clouds.
Curated OER
Weather Systems
Fourth graders research weather phenomenon in groups on the Internet and create a slide for the class power point presentation. They include 5 key points (temperature, air pressure, and fronts and descriptions for each type of cloud or...
Curated OER
Observing, Describing, And Identifying Contrails
Students compare the three types of contrails that are produced by aircraft exhaust. They examine pictures of contrails on the internet to classify each as short lived, persistent or persistent spreading. They then sketch examples in...
Curated OER
Weather... Or Not
Students observe and discuss the local weather patterns, researching cloud types and weather patterns for cities on the same latitude on the Internet. They record the data for 6-8 weeks on a graph, and make weather predictions for their...
Curated OER
Comets and Meteors
Young scholars construct a model of a comet nucleus using dry ice. They add other materials and describe the features. They complete related exercises on an Internet Web site.
Curated OER
Weather Facts Internet Hunt
In this weather instructional activity, students click on the links in the questions about weather to find the answers to the questions and then come back and answer the questions. Students answer 17 questions total.
Curated OER
Sun and Clouds
First graders use Kidspiration software to practice putting pictures on screen in a straight line. They examine pictures of suns and clouds and create as many different combinations of seven from pictures that they can.
Curated OER
Clouds and Rainfall
Students use the general climate section of the Digital Atlas of Idaho.
Then they identify and interpret some basic concepts about climatology. Students also read through the information contained in the Digital Atlas on Climatology....
Curated OER
Figurative Language in Toni Morrison's "A Mercy"
In order to read and respond to Toni Morrison's A Mercy in this figurative-language instructional activity, students discuss the differences between a literal and a figurative interpretation of a text. They explore figures of speech...
Curated OER
Explore Point of View Through Aerial Photography
Read the story Amelia the Pigeon and discuss perspective. Since Amelia is a pigeon with a bird's eye view, use aerial photography to enhance your learners' understanding. Have fun connecting art and literature while talking about...
Curated OER
Observing Weather
Students investigate the weather by reading children stories. For this weather observation lesson, students read Cloudy With a Chance of Meatballs and several other stories about weather before they create a KWL chart. Students utilize...
Curated OER
Science: How's the Weather?
Fifth graders brainstorm meteorological terms to create a semantic web using SuperPrint. For each topic, they create instruments, such as barometers or psychomotors, that they use to make scientific predictions about the weather. After...
Curated OER
Weather Map
Ninth graders utilize several different types of maps to forecast weather conditions specific areas of the country. Air masses, wind, cloud types, fronts, and the pH of the rain is explored in this lesson.
Curated OER
Gathering Weather Information
Students watch a video of a recent weather disaster. Using the internet, they work together to examine the weather forecast for tomorrow and next week and discuss why it is important to know the weather. In groups, they use weather...
Curated OER
Why is the Average Temperature Greater on Venus than on Mercury?
Students examine the reasons why the temperature is higher on Venus than on Mercury. In groups, they analzye both planet's atmospheres and determine the rate of global warming on each. They use the internet to research the planets in...


