Curated OER
Looking at Data
Third graders use two days to create, collect, display and analyze data. Classroom activities and practice build greater understanding to a variety of forms used to display data.
Curated OER
Data Analysis and Data Explorer
Students use the Data Explorer software to organize and display the test scores for the classes in stacked box-and-whisker plots, then analyze the results in paragraph form.
Curated OER
Explore: Collect And Organize Data
In this exploring how to collect and organize data worksheet, young scholars, working with a partner, problem solve the answers to seven word problems involving data.
Curated OER
Investigating: Interpreting Graphs and Analyzing Data
Students explore statistics by researching class birthday data. In this data analysis lesson, students investigate the different birthdays among their classmates and create data tables based on the given information. Students view bar...
Curated OER
Fitting a Line to Data
Students work together in groups to collect data in relationship to how much water marbles can displace. After the experiment, they use the data to identify the linear equation to determine the best-fit line. They use the equation to...
Curated OER
Data Analysis
Students examine techniques to represent data. In this data analysis lesson plan, students read about various ways to represent data, such as a stem and leaf diagram and calculating standard deviation. Students complete data analysis...
abcteach
What is Your Favorite Month?
A simple worksheet that helps learners conduct a survey is here for you. In it, pupils collect data on their family and classmate's favorite months. Youngsters use tally marks in the spaces provided to keep track of the answers. Once...
Curated OER
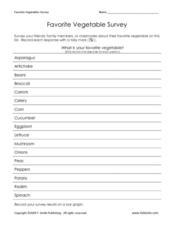
Favorite Vegetable Survey
What's your favorite? Use this chart template in your lesson on data collection and graphing. Learners record classmates' favorite vegetable in a survey, and then graph the results. A labelled graph is provided here- print both pages...
Curated OER
How Many Fish in the Pond?
How many fish are in Mills Pond? Learners examine an image with 17 fish. There are four types of fish, each of which is displayed on a data chart. Focus on collecting data and counting as scholars record the number of each type in its...
Curated OER
Famous Authors Biographical Data Form
Who wrote To Kill a Mockingbird? What about Wuthering Heights? Prodigal Summer? Encourage learners to study the authors of their beloved books. This form will help them organize information as they learn about different authors. After...
Curated OER
How Much Do I Watch TV?
For this television watching worksheet, students determine the amount of television they watch in a week by recording the names and times of the shows. They total the number of hours of watching time. You can use this with upper...
Curated OER
Interpreting Your Data
In this water quality sampling learning exercise, students organize and analyze their data from samples they have collected. After analyzing based on 9 guide questions, they complete 18 short answer questions about fish, benthic, and...
Curated OER
Handling Data: Coin Tossing Simulation
Students collect experimental data and record it on a frequency table. After accessing an Internet coin toss simulation site they discover that repetition of an experiment may result in different outcomes. They identify the mutually...
Curated OER
Cloud Types
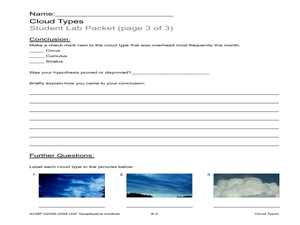
Students examine cloud types. In this cloud lesson, students identify cloud types, observe clouds and collect data, and analyze data to identify the most common cloud they observe overhead during the course of a month.
Curated OER
Locating Vent Fields Using CTD Data
Students describe the way hydrothermal vents work. Students work on locating vent regions through remote collection of data about water temperature and density. Comparing density and temperatures graphs, students search for indicators...
Curated OER
Collecting Data
In this algebra worksheet, students collect and analyze data. They graph and identify their solutions. There is one question with an answer key.
Curated OER
Ranging the Triple M's
Fifth graders explore collecting and analyzing data. In this mean, median and mode lesson, 5th graders use real word data to determine the mean, median and mode. Students are given sets of numbers on index cards as asked to find the...
Curated OER
Lesson 1: Map Data and the Census
Students learn about the history of the census. In this U. S. Census lesson plan, students develop an understanding about how the United States Constitution grants and distributes power and discover how the spatial organization of...
Curated OER
Teacher's Plant Collection Guide
Young scholars explore a variety of guidelines that involve collecting plants in a responsible manner and participate in a plant pressing activity. In this teacher's plant collection guide lesson, students collect data regarding plants,...
Curated OER
Graphing Predator/Prey Data
Learners use data from the Camouflage Game (played with red and green yarn caterpillars) to create a composite bar graph to display the collected data. They interpret the data and form a conclusion based on the graphs. Teachers may use...
Curated OER
Quantitative Data
In this algebra instructional activity, students collect data using tally marks. They then record their data, graph it and analyze it. There are 23 questions with an answer key.
Radford University
Projectile Motion and Quadratic Functions
Model the flight of a ball. Small groups collect time data for how long it takes to toss a ball between two people. The teacher leads a discussion about projectile motion to get the class thinking about how to calculate the equation of...
Curated OER
What Goes Up Must Come Down!!
Fifth graders look at actual sunrise and sunset times for their hometown to determine a pattern in the amount of daylight. They collect their data in Excel and create a chart to help them identify the pattern, then write an explanation...
Curated OER
Linear Regression and Correlation
Learners explore scatter plots. For this linear regression lesson, groups of pupils graph scatter plots and then find the line of best fit. They identify outliers and explain the correlation. Each group summarizes and shares their...


