Curated OER
The 400-Meters Race
Students collect and graph data. In this algebra lesson, students describe, interpret and analyze data. They follow a 400 meters race and plot the coordinates of the course. They graph a line to represent the data of the course.
Curated OER
Independent Investigation
In this science worksheet, students write what they want to discover and identify what they feel will happen. Then they design an experiment and write the steps for it in the space provided. Students also create a data table or chart...
Curated OER
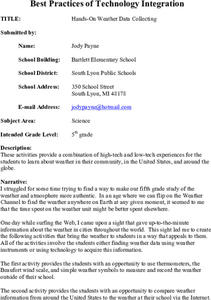
Hands-On Weather Data Collecting
Fifth graders use Internet sites to complete a study of weather and atmosphere. They compare weather data from cities around the world. They use thermometers, the Beaufort wind scale, and simple weather symbols to measure weather around...
Curated OER
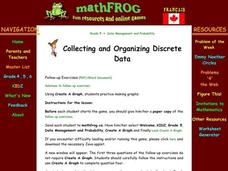
Collecting and Organizing Data
Fifth graders explore methods of generating and organizing data. Afterward, they visit a specified website where they analyze data, organize, and create graphs. Students follow instructions and complete answers to questions. They...
Curated OER
Probability and Statistics
Students are taught to search the internet for statistics concepts on sports. In this probability lesson, students collect data and use the calculator to graph and analyze their data. They graph and make predictions about sports using...
Curated OER
Oil and Energy Consumption
Young scholars analyze the oil consumption and production information. In this investigative lesson students take the data collected, graph and organize it then draw conclusions about the use of oil worldwide.
Curated OER
Collecting Data
Fifth graders collect and describe data. Through various inquires, they collect information and describe it in graph form. Students predict information, find the actual amount based on their data and compare their findings with their...
Curated OER
Correlating Atmospheric Data Lesson Plan
Students make and test hypotheses about atmospheric data collected aboard the NOAA ship Ronald H. Brown research cruise.
Curated OER
Generating and Recording Data
Students demonstrate their ability to collect, organize, and display data. They examine everyday objects that can be turned into a function machine for the lesson plan. They use colored fish to help them organize their data.
Curated OER
How Long...?
Students explore measurement. They use appropriate units of measurement for different sized objects. Students collect their data and enter it into an Excel data base. They graph their findings and analyze their outcomes.
Curated OER
Sundials and Shadows - What Can They Teach Us About Seasons?
Students collect and analyze data relating to seasonal changes. They view a video, research web sites and build a sundial to collect their data.
Curated OER
Graphing Pendulum Results
Sixth graders set up a pendulum experiment deciding which variable to manipulate (length of string or weight on the string). They create a hypothesis, collect necessary equipment, and write out each step of their experiment. They then...
Curated OER
Comparing Temperatures and Latitudes
Eighth graders collect weather data from a variety of cities at the same latitudes, but on different continents. They organize data using spreadsheet program, generate graphs, and incorporate into a word processing document. Students...
Curated OER
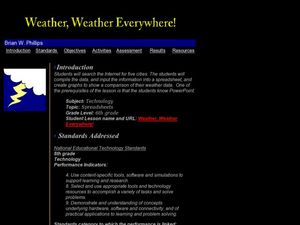
Weather, Weather, Everywhere!
Sixth graders collect weather data to compare temperatures around the world. Using the Internet, learners collect data, put it into spreadsheets, and analyze and graph the results. An interesting way to cover the topic of weather.
Curated OER
Background of Diseases-- Germs or Genes?
Students explore the background of common diseases. In this personal health lesson, students research causative agents of communicable and non-communicable diseases. Students use their research findings to create data tables in Microsoft...
Curated OER
Graphs: All About Our Class
Students respond to survey questions, discuss results, brainstorm ways to represent survey information, and create table of class results. They find mean, range, and percentages, and create graph to display results.
Curated OER
Hemlock Trees and the Pesky Pest, The Woolly Adelgid
Students review Excel and how to create graphs with this program. They create two graphs in Excel, one showing the average number of woolly adelgid egg sacks on the outer 15 cm of hemlock branch at sites sorted by latitude, then one...
Wind Wise Education
Can Wind Power Your Classroom?
Can you power this? Individuals do an energy audit for the classroom to determine the amount of electricity needed to power it. Using either live data or sample data from wind turbines they decide whether it would power the classroom....
Curated OER
Applied Science - Science and Math Pre-Lab 4C
Scholars classify the sciences. Using applied science, they compare and contrast subfields of sciences. They compare qualitative versus quatitative. They discuss types of sciences and the meanings of the word roots of the names.
Curated OER
Vectors: Follow That Arrow
Vectors and their connection to motion. A video will be presented to provide information for the class to use methods of solving vectors with and without grids. Real-world physical concepts will be explored in reference to vectors.
Math Worksheets Land
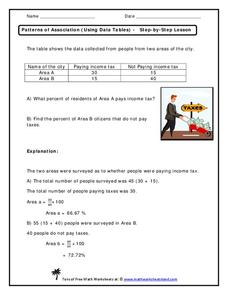
Patterns of Association (Using Data Tables) - Step-by-Step Lesson
This worksheet belongs to a four-part resource that gathers information from data tables to calculate percentages. The page introduces one problem and shares an explanation to the answer.
Curated OER
Pancakes, Anyone?
First graders explore data collecting and graphing. In this data collecting and graping lesson, 1st graders watch a video about monster who sells pancakes. Students make a graph to record the most popular pancake. Students also play...
Curated OER
Biology Project: Gone Fishing
Students write a scientific article using data and prediction skills. In this scientific writing lesson, students access data about fishing off the coast of New Jersey. They look at satellite data, fluorometry and CTD data over a 3 -4...
Curated OER
You're the Scientist
Students explore ways to assess the accuracy and reliability of data reported by Journey North observers.


