Curated OER
Introduction to Bar Graphs Lesson Plan
Students organize and interpret data using bar graphs.
Curated OER
Marvelous Magnets
Students identify and classify magnetic and nonmagnetic materials and metals. After determining which materials and metals are magnetic, students create a data table and classify items by two different criteria. Students e-mail various...
Curated OER
CSI Clamshell Investigation
Students explore predator/prey relationships. They research information on moon snails and claims. Students draw conclusions from the data collected. They use math and graphing to determine if there is a relationship to the clam's size...
Curated OER
Checking County Numbers
Learners use their county's information page to gather information about their community. Using the information, they create graphs from the tables provided and interpret the data. They write a paragraph showing their interpretation of...
Curated OER
Tree Study
Students measure the lengths of provided leafs to the nearest millimeter. Students identify trends in the data as well as sourced of inaccuracy and formulate additional questions that could be investigated to enhance their understanding.
Curated OER
Backyard Critters
Young scholars explore the characteristics of invertebrates in their backyards. They observe, describe, and classify specimens. They conclude with a "snail race."
Curated OER
Insect Monitoring
Students participate in an interactive lesson plan using the scientific method to study biodiversity. In this insect monitoring lesson plan, students simulate the layers of soil and the insects that would live there. Students design...
Curated OER
Life in a Forest Stream
Students assess macro-invertebrates from a stream. In this science lesson plan, students observe, classify and identify organisms found in a stream. A lab station is constructed at the stream sight and students study the different...
Curated OER
Excel temperature Graphs
Students gather data about the weather in Nome, Alaska. In this Nome Temperature lesson, students create an excel graph to explore the weather trends in Nome. Students will find the average weather and add a trend line to their graph.
Curated OER
Sorting Through Spiders
Students utilize their own drawings of spiders to analyze and sort the attributes that each student drew.
Curated OER
Math: Graphs and Their Symbols
Second graders examine different types of graphs and discover the meanings of the symbols used on them. After gathering data about themselves, their communities, and the world, they use that information to create graphs. Among the...
Curated OER
Food Classification
Students are introduced to classification and some of the difficulties surrounding classification and how classification systems need to be able to adapt and how they may need to be changed when new information is discovered. They...
Curated OER
Away We Go!
Students study types of transportation. In this transportation lesson, students survey several classes to gather data on how they get to school. Students create a transportation graph.
Curated OER
Prairie Restoration and Prairie Ecology
Students collect data as they identify and classify native prairie plants and insects. They create their own population study using a variety of sampling techniques to determine the population density of various species. Students...
Curated OER
Aquatic Organisms and Their Habitats
Students investigate the presence of specific organisms in a freshwater habitat to determine the quality of that habitat. They conduct a field study and distinguish and classify organisms found during the field study.
Curated OER
What's Under My Feet?
Students choose one rock from a collection of igneous, metamorphic, and sedimentary rocks. They use multiple resources to create an informational brochure highlighting their rock. The brochures are combined into a class rock museum to be...
Curated OER
Red Tail Ridge Wetland Study Project
Fifth graders use a real life scenario of the wetlands to gather information on creatures of the habitat. In this wetlands lesson, 5th graders research the interdependence of organisms in a healthy habitat. Students collected samples...
Curated OER
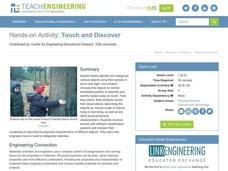
Touch and Discover
Young scholars work together to identify and categorize objects. They have to identify the object on touch because they are blindfolded. They record their data and describe the objects once they can look at them.
Curated OER
Will It Sink or Float?
Students perform experiments to see if items will sink or float. In this sink or float lesson, students work in groups to make predictions, and record the results. After the experiments are complete students make a book of the results.
Curated OER
Bodacious Buttons
First graders participate in games, graphing, and probability exercises to sort and graph buttons. They sort buttons with Venn diagrams and Bull's Eye graphs.
Curated OER
Magnetic Discovery Bottle
Young scholars examine how to conduct simple investigations and use simple equipment to gather data. In this magnet lesson students decide what types of objects are attracted to magnets.
Curated OER
Strongest Polygon
Students define and identify shapes by name. In this geometry lesson, students construct, identify and compare polygons based on the number of sides. They classify each shape based on their angle sum theorem.
Curated OER
In the Field with Salamanders
Students observe salamanders, take pictures of them, and classify them into an online format. In this animal classification instructional activity, students use collection materials and digital camera to photograph and observe...
Curated OER
Mathematical Magazines
Young scholars classify and tabulate the type of advertisements found in a collection of magazines. Determination is made on what percent of the total number of ads each type represents. They present their results orally and in a graph.


