Curated OER
What Does Average Look Like?
Fifth graders explore the concepts of range, median, mode, and mean through the use of graphs drawn from models. They use manipulatives to represent data they have collected within their groups, and compare the differences between mode,...
Curated OER
Venn Diagram and UK Basketball
Students analyze data and make inferences. For this algebra lesson, students collect and analyze data as they apply it to the real world.
Curated OER
Olympic Bar Graphs
For this Olympic bar graph worksheet, students pick a sport from the 2004 Olympic games and find data from the Olympic web page. They graph the scores (times, distance, or speed) and the medals. They answer questions about the variables...
Curated OER
EXCEL It!
Learners surf the Web gathering information about graphs. The data collected is incorporated into an Excel spreadsheet and graphs of varying nature generated to further enhance student understanding.
Curated OER
Where Do I Fit on the Graph?
Students collect data and create graphs about themselves, their community, and the world around them. They use a variety of methods to organize data, such as stickers, clothespins, name tags, coloring, tally marks, etc.
Curated OER
Reaction Time
Third graders review important vocabulary to explain measures of central tendency and reaction time. In pairs, they measure reaction time of dropping and catching a ruler. Data is collected after repeated catches and information is...
Curated OER
School Lighting Audit
Learners identify the data included in an energy audit. They perform an audit on the lighting in their school building. They complete a worksheet and discuss lighting issues with school staff.
Texas Instruments
Measure Up!
Statisticians take things to new heights using a set of height measurements. Students use TI-82 or TI-83 calculators to determine extreme values and the median for the data. They also construct a box-and-whisker plot to summarize the...
Curated OER
Corn-Crop is a Bin-Buster
Learners calculate percent change and create lists of data. They enter the corresponding bushels of corn measured in billions to their list and display, then convert the acres into scientific notation and use the value on the home screen...
Curated OER
How Long? How Wide?
Second graders distinguish between and use nonstandard and standard units of measurement, use appropriate tools and techniques to measure length and width, and record and interpret data using graphs.
Curated OER
Diffusion
Students design and carry out an experiment according to the scientific method. The experiment must test the effects of time and concentration on the rate of diffusion of potassium permanganate into potato cubes. After performing the...
Curated OER
Be the Kiwi
Students analyze linear equation. In this algebra lesson, students analyze and graph data. They solve problems involving linear equations and graph lines using the slope and y intercept.
Curated OER
Weather
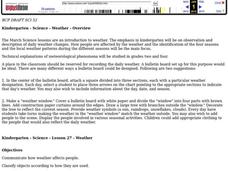
Students communicate how weather affects people, classify objects according to how they are used, and observe and record weather data using symbols.
Curated OER
Pulling It All Together
Students review data about a health problem and prepare an investigative report. Teams trade reports and utilize skills developed from previous lessons to evaluate the critical thinking evident in the reports.
Curated OER
Under the Sea - Ocean Mammals/Fish
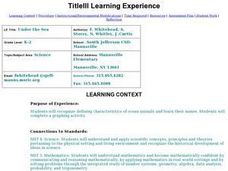
Students explore the similarities and differences between ocean mammals and fish. The characteristics of the life forms observed are placed onto a graph. The classroom becomes the botom of the sea and is explored to gain the required data.
Curated OER
Graphing Surveys
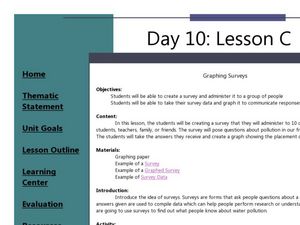
Students collect data and graph it. In this algebra lesson, students create a survey for their classmates and teachers. They analyze the results from the survey and graph it. They draw conclusion from their data based on the graph.
Curated OER
Electricity--More Power to Ya!
Fourth graders use research tools to access and synthesize information. They gather and manipulate data using technology. Research and study the components of an electrical circuit. Create a brochure that demonstrates knowledge of how to...
Curated OER
Weather "Whys" Lesson 4: Spring
Students explore the attributes of spring. In this weather lesson plan, students collect data regarding weather from various media. Students graph simple weather data and dress animals for forecasted weather. Students discuss the...
Curated OER
Motion Musing
Students investigate graphing a line. In this algebra lesson, students collect data on the path of a skateboarder. They collect how fast the board is traveling along a straight line and graph their results.
Curated OER
Meats Make Muscles
Second graders explore the meat group of the food pyramid. In this nutrition and diet activity, 2nd graders study the benefits of eating foods in the meat group, collect data regarding their classmates' favorite foods, and create a graph...
University of California
Hot! Hot! Hot!
Calories are not tiny creatures that sew your clothes tighter every night, but what are they? A science activity, presented at multiple levels, has learners experiment with heat, heat transfer, and graph the function over time. It also...
Curated OER
Data Collection Project
Students collect data using email. They calculate the mean, median, mode, range and outliers. They create a graph using the data results. They write five paragraphs to summarize their data.
Curated OER
Graphing Data
Second graders examine how to make and read bar graphs. In this bar graph lesson, 2nd graders compare bar graphs to pictographs by looking at hair color survey data. They practice making a bar graph and finding the range of the data.
Curated OER
Graphing and Analysis of Water Quality Reports
Students practice making graphs and interpreting them. They compare and contrast different sets of data. They use Microsoft Excel to create different types of graphs.


