Curated OER
What Are We Listening To?
Students gather data from a web site on number of music albums sold by genre for the last two years. They convert these figures to fractions, decimals, and percents, and display the results in bar graphs and pie charts.
Curated OER
Spreadsheet Budget Project
Eighth graders record all the food they eat for one week, compute the costs for all of this food, and display the different categories on a spreadsheet and then convert to a chart.
Curated OER
How Effective is Perspiration at Cooling?
Students collect data on the cooling of water in two different test tubes, one that is wrapped in wet newspaper and one in dry newspaper. They then relate this cooling effect to the body's perspiration.
Curated OER
A Bar of Many Colors
Second graders use colored candies to collect data, construct double bar graphs, and find averages.
Curated OER
Traffic Light Probability
Students discuss the possible traffic signals that may be observed on the way to a field trip. They record data on the trip, and analyze the probability of the results occurring again.
Curated OER
Cultural Ties in Your Nebraska Community
Tenth graders use different resources to collect data about how their specific community is affected by international ties and relations. Resources include local library, city hall, travel agent, visitors bureau, and Chamber of...
Curated OER
Stimulus/Response in Invertebrates
Students design and conduct and experiment to determine how invertebrates react to an outside stimulus such as light and other stimuli. Student must develop a clear plan of action, collect data in an organized manner and analyze their...
Curated OER
Leap Frog Experiment
Second graders ask questions and design an experiment to explore different spinners in "The Leap Frog" board game. They conduct their experiment, collect information and interpret the results using a graph.
Curated OER
Graphing Valentine Candies
Fifth graders organize and display information in bar graph form using appropriate labels. Each student receives a box of Valentine heart candies, a worksheet of the tally chart and a worksheet of the bar graph.
Curated OER
How to Make Histograms
Students collect data and plot it using a histogram. In this statistics lesson, students interpret histograms. They find the frequency, percents and density.
Curated OER
Commemorative Coin Poetry
Pupils discuss and research an individual or event that has been memorialized on a commemorative coin. They use the information they found to write acrostics, creating stand-up accordion books to display the poems.
Curated OER
Ants in Your Pants
First graders read "One Hundred Angry Ants" by Elinor Pinczes. They identify various sums that equal ten and display them on a chart.
Curated OER
A Canadian Inventory: The Way We Are!
Students, in groups, explore major thematic sections of the Atlas of Canada. They use their findings to produce a wall display, consider and incorporate the issue of sustainability into their material and deliver a presentation to the...
Curated OER
Consumerism Scavenger Hunt
Young scholars explore consumerism. In this economics lesson, students work with a partner to complete an Internet Research consumer scavenger hunt. Young scholars discuss information collected and conflicting answers to various questions.
Curated OER
That's the Way the Ball Bounces
Students investigate and compare the bouncing ability of the materials from which four different balls are made. They determine which material performs the best for use as a basketball. After collecting data in a small group they...
NOAA
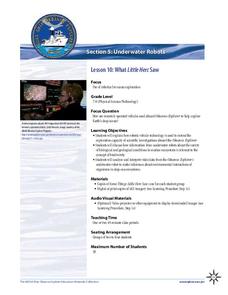
What Little Herc Saw
See the underwater world through a different pair of eyes! Middle school marine biologists identify deep-sea organisms by examining images taken by an ROV from the Okeanos Explorer. After determining what creatures lie beneath the...
Curated OER
Who Turned the Lights Out?
Students discover the life cycle of butterfly by observing its growth from egg to caterpillar and the formation of its chrysalis. Students conduct an experiment in which they design housing for the chrysalises which are either in full...
Curated OER
RISKY BUSINESS--OR NOT!
Students learn about the importance and risk that stocks carry within a business. In this financial management lesson, students use role play and case scenario situations to decide what stocks are best for given companies. Based on the...
Curated OER
Weather "Whys" : Introduction to Weather
Students discuss weather forecasts and different types of weather. In this weather instructional activity, students observe the weather and learn a weather song. They listen to a story and see weather measurement tools.
Curated OER
Splish, Splash Poetry
Students write weather shape poems and sing weather related songs. In this creative writing activity, students read the book, It's Raining, It's Pouring and list weather words they heard in the story. Students use the writing process to...
Curated OER
Weather "Whys" Lesson 2 Seasons
Young scholars explore seasons. In this cross curriculum weather and seasons lesson plan, students identify characteristics of the four seasons and sequence related pictures. Young scholars listen to poems and stories about trees in...
Curated OER
Nutrients
Fourth graders understand the important nutrients in food and the value of each. In this nutrients lesson, 4th graders complete a chart giving examples of foods that contain that nutrient and a definition of the nutrient. Students...
Curated OER
And the Winner Is...
Third graders participate in an election project. They collect data to create a spreadsheet from which a graph is generated.
Curated OER
What Do Plants Need to Grow?
Fourth graders control variables to determine the effect on plant growth. They collect information by observing and measuring and construct simple graphs, tables, maps and charts to organize, examine and evaluate information.


