Curated OER
Water Resources
Learners explore the differences between surface water and ground water. They collect data using maps and graphs and investigate a Texas river basin and a nearby aquifer. They complete a written report of their findings regarding the...
Curated OER
Jumping Rope-How Fit Am I?
Students collect data over a 10-week period in their Physical Education class on how many jumps they can do in a minute period or another time period specified by the instructor.
Curated OER
Memories
Fifth graders collect artifacts of their fifth grade school year and make a technology based Memory Book.
Curated OER
Goobers. Goobers? Goobers!
Students begin the lesson by noting the many ways in which to use peanuts. In groups, they use the internet to research the work of George Washington Carver. They discover the allergies and nutritional information of the peanut and...
Curated OER
Getting Graphs: Researching Genealogy-A Piece of Pie
Third graders research their genealogy. In this math lesson, 3rd graders collect data and create graphs and charts. A presentation of their findings is given.
Curated OER
"How Tall, How Short, How Faraway" by David A. Adler
Students list in a journal what "measurement" is. They measure with standard and non-standard units and record data on a class chart. They also construct a meter tape.
Curated OER
Using technology to engage students in science through inquiry research
Students study animals and their behaviors. For this animal behavior lesson students divide into groups and collect data and research animal behaviors.
Curated OER
Body Length Experiment
Students measure the lengths of their bodies and various body parts to determine the relationship (or lack of one) between body part length and the length of the entire body. A spreadsheet program is suggested for data collection.
Curated OER
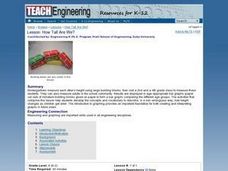
How Tall Are We?
Young scholars in a Kindergarten class measure each other's height using large building blocks and then visit a 2nd and a 4th grade class to measure those students. They display the results in bar graphs, comparing the different age groups.
Curated OER
Penguin Heights
Young scholars use the worksheet from the first website listed below to collect data on the penguin heights on the Penguin Page.
Curated OER
Best Buy!!
Students use newspaper ads to determine the best buy on products. They enter the information into a spreadsheet and then use word processing software to complete a written analysis, complete with graphs.
Curated OER
And Around We Go!
Sixth graders conduct a survey and collect data to construct a bar graph that will then be changed into a circle graph. With the bar graph, 6th graders compare estimated fractions and percentages and estimate percentages. With the circle...
Curated OER
Finding the Flu
Students work to determine when the flu is most prevalent in the United States. They gather data on their own, create calendar, charts, and graphs, analyze their findings and present them. This is a very appropriate winter lesson!
Curated OER
Devising a Set of Experiments to Test Water for Dissolved Substances
Students work together to test water samples for pollutants. They design data tables to collect and record their observations. They complete discussion questions to end the lesson.
Curated OER
Learning About Our Five Senses
Students study the sense of touch and various degrees of heat. They design a model that displays how the human hand reacts to heat using a touch sensor.
Curated OER
Patterns of Settlement in Early Alabama
Fourth graders study the settlement of Alabama. They collect data from the U.S. census website and answer questions regarding settlement patterns in the counties of Alabama in 1820. They write a paagraph describing where they would have...
Curated OER
Environment: Natural and Invasive Plants
Students examine a parcel of open land to collect data about the native and invasive plants found there. By monitoring the area, they prevent the spread of weeds through early detection. Students create posters describing the monitoring...
Curated OER
Noise Levels, Bar Graphing, and Fractions
Students research items that can damage hearing. They explore statistics about the decibels of certain objects. From the information collected, students create a bar graph. They formulate ratios to determine what sounds are harmful to...
Curated OER
Got Biodiversity?
Students examine the concept of biodiversity. Using the internet, they complete small activities in which they work together. Using the information they collected, they create a class book, make murals and write in their journals.
Curated OER
Famous Person Admired
Students research a famous person they admire. Students conduct Internet research to gather and store facts about the historic person in order to write essay, they also collect pictures for a collage.
Curated OER
How Acid Rain is Measured and Monitored in the U.S.
Explain how acid rain is measured. They discover how acid rain is monitored in the United States. They compare locally measured pH or rain with that of Great Smoky mountains. They perform Ph tests on rainfall they collect.
Curated OER
Ladybugs in the Garden
Fifth graders estimate the size a population (ecosystems) Students make a chart from information collected then create a graph (line or bar) from this information. Students do a lesson where they observed, examine, and record data...
Curated OER
Picture Tomorrow
Students discuss their plans for the future. they draw pictures of something from their future that they plan to do or be. They display their art work in the classroom.
Curated OER
Manatee Awareness Survey
Students examine the public's awareness of manatees by taking a survey. They display the results of the survey as a graph.


