Curated OER
Shopping the Sunday Circular
Pupils demonstrate an understanding of price-per-unit mathematics. In this computation lesson, learners accurately figure the unit price of grocery items. They create a chart and record the item, the price, the size and the cost per item.
NTTI
Line 'Em Up!
Coordinate planes and Cartesian graphing systems are the focus of this math lesson. Learners use video, internet activities, and engage in hands-on activities in order to explore coordinate planes. The materials needed for this lesson...
Curated OER
What are Igneous Rocks and How are They Formed?
Crystals form before your very eyes! What sixth grader wouldn't enjoy this lesson plan on igneous rock formation? Using hot Salol, junior geologists observe the crystal formation process as the material cools. This comprehensive lesson...
Curated OER
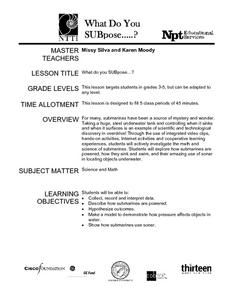
What Do You SUBpose?
Submarines are the fous of this math and science lesson. In it, learners explore the world of submarines: how they work, and what they are used for. They engage in hands-on activities, watch video clips, and work in cooperative groups in...
Curated OER
Scatter-Brained
Seventh graders graph ordered pairs on a coordinate plane. They create a scatterplot. Additionally, they determine the line of best fit and investigate the slope of the line. Multiple resources are provided. An excellent resource!
Curated OER
Seein' Double, Seein' Double
By using the Internet, hands-on activities, video, and cooperative learning, pupils look into the conditions in which light casts shadows on objects. The lesson includes fabulous hands-on activities, art projects, worksheets, and reource...
Curated OER
Genetics Survey Project
Complete a survey on genetics and the mechanics of heredity.and review the list of human traits observed. Practice interviews are conducted with each other so that noone feels unconformable if they don't have one trait or another. One...
Curated OER
Yellow Pages Ad-dition
Students determine the revenue generated by sample pages from the Yellow Pages. They discuss the value of advertising a business in this venue. They use the local telephone directory and some fictitious ad rates to lead their inquiry.
Curated OER
Exploration of 'pill bugs'
Fifth graders define words. They create a dichotomous key. After carefully examining pill bugs, 5th graders record observations. They compare and contrast habitats of pillbugs.
Curated OER
Graphing Regions: Lesson 2
Students identify and analyze geographical locations of inventors. They each identify where their inventor is from on a U.S. map, discuss geographic patterns, and create a t-chart and graph using the Graph Club 2.0 Software.
Curated OER
Misleading Graphs Lesson Plan
Students design and build water balloon catchers from random scrap materials, while taking into consideration a multitude of variables including: cost, maintenance, total capacity, etc.
Curated OER
M&M Math
Pupils sort a bag of M&M candies according to color using a sorting mat. They count M&M candies. They compare the number to their prediction then students create tally charts.
Curated OER
Student Costs Graph
Students calculate the mileage, gasoline costs, and travel time and costs for a vacation. They conduct a virtual field trip, and create a comparison graph of costs using Microsoft Excel software.
Curated OER
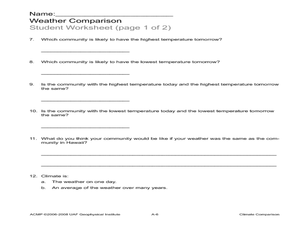
Climate Comparison
Students explore climate regions. In this climate lesson, students examine the climate regions of Alaska as well as the state of Hawaii. Students research selected Internet sources to gather information regarding the climates present in...
Curated OER
Design-A-Room Project (Part 3 of 3)
Students culminate a unit on measurement with a focus on area and perimeter. They design a floor plan of their dream room on graph paper showing the proper area and perimeter. They plan the budget for their room and make a 3-D scale...
Curated OER
Graphing Favorite Holidays
Students create spreadsheets and bar graphs based on results of survey of favorite holidays.
Curated OER
RCX Car Line Graph
Students develop a line graph based on distances that an RCX car drives in specified amounts of time. They then are given a specific amount of time for the car to drive and be asked to extrapolate the car's distance from the graph.
Alabama Learning Exchange
What's Your Favorite Chocolate Bar?
Young scholars complete a math survey. In this math graphs lesson, students complete a survey about their favorite candy bars. Young scholars create different kinds of graphs using Microsoft Excel to show their results.
Curated OER
Chemical Weathering
Students measure the effect of water temperature on the rate of a chemical reaction, similar to the interaction of a weak acid and carbonate rock, using hot water and effervescent antacid tablets.
Curated OER
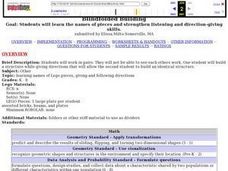
Blindfolded Building
Students build a Lego design and then work with a partner to reproduce that design. They guide the building of the reproduction by description only and then check their work.
Curated OER
Arrange the Classroom (Part 1 of 3)
Fifth graders arrange the classroom using all the moveable objects and through the exploration of area and perimeter. They determine the area of the classroom, create and label model pieces of furniture using graph paper, and create a...
Curated OER
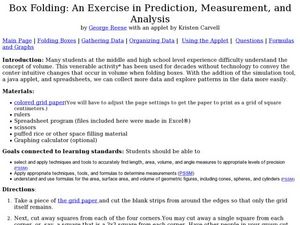
Box Folding: Predict, Analyze and Measure
Young scholars predict the shape of a geometric figure in 3D. In this geometry lesson, students construct 3D shapes to perfect their knowledge of measuring and predicting. This assignment is also available as an online interactive lesson.
Curated OER
The Strongest Shape
Students work collaboratively to design and construct a roof out of Legos for a house that was built in a previous instructional activity. The roof must be structurally sound and pass certain criteria determined by the teacher.
Curated OER
Discovering the Problem of Solid Waste
Learners catagorize the types of garbage from going through a trash can provided by their teacher. They then chart the items on a graph and propose a solution to reduce the amount of garbage.


