Curated OER
Skittle Graphing (Lesson Plan)
Students discuss the uses of graphs. They use color candies to count and sort before designing graphs. They label the graph papers with appropriate titles and candy colors. They complete the graph bars, and discuss the results with a...
Curated OER
Census Statistics and Graphing
Students graphically represent data from the Census. In this middle school mathematics lesson, students investigate the housing characteristics of different tribes of Native Americans and compare them to the average American...
Curated OER
Activity Plan 5-6: What's In a Name?
Students use family names to gather and analyze data. For this counting lesson, students use graph paper to help organize their data and then, in a staircase fashion, organize the names from longest to shortest so they can answer...
Curated OER
Countdown to Disaster
Students discover the potential dangers of weather in their hometown. In this environmental lesson, students research Hurricane Hugo and the devastation it caused South Carolina in 1989. Students record weather data from their city and...
Curated OER
Dinosaur Tracks: From Stride To Leg Length To Speed
Students determine the relationship between leg length, stride length, and speed in humans and bipedal dinosaurs. They collect data and graph these human characteristics then use actual data collected from dinosaur track pads and fossils...
Curated OER
Mean Meadian and Mode
Students apply central tendencies to given data. In this statistics lesson, students calculate the mean, median, and mode as it relates to their data. They collect data and graph it while identifying the way the numbers are ordered.
Curated OER
Cockroach Slope
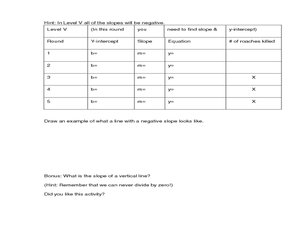
Students identify the slope of linear functions. In this slope lesson, students collect data and graph it. They write equations with no more than two variables and use technology to explain their data.
Curated OER
RIP M&M's
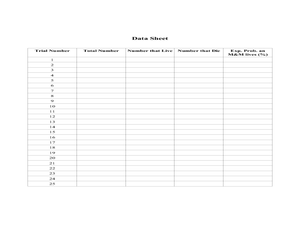
Students solve theoretical probability problems. In this algebra lesson, students apply the concept of probabilities to solving real life scenarios. They collect data and graph it using experimental probability.
Curated OER
Model and Solve Algebraic Equations
Examine multiple ways to solve algebraic equations. Pupils will generate a problem solving strategy that addresses the prompt given by the teacher. They will then share their problem solving strategy with the class. Graphic organizers,...
Curated OER
How Trees Contribute to the Water Cycle
In this water cycle instructional activity, 3rd graders conduct an experiment where they observe and calculate how water transpires in different types of trees. Students engage in a class discussion and use Venn Diagrams to compare...
Curated OER
Billions of Bubbles
Students conduct an experiment with bubbles. In this observation and comparison lesson, students read Bubbles, Bubbles, Everywhere and conduct an experiment where they test different kinds of liquids to see which is the best for a...
Curated OER
Raisin the Statistical Roof
Use a box of raisins to help introduce the concept of data analysis. Learners collect, analyze and display their data using a variety of methods. The included worksheet takes them through a step-by-step analysis process and graphing.
Curated OER
Data Analysis of Ground Level Ozone
Sixth graders construct and interpret graphs from ozone data collected in Phoenix area. Can be adapted to other areas.
Curated OER
Box Plots
Young statisticians are introduced to box plots and quartiles. They use an activity and discussion with supplemental exercises to help them explore how data can be graphically represented.
Curated OER
Play It
There are a number of activities here that look at representing data in different ways. One activity, has young data analysts conduct a class survey regarding a new radio station, summarize a data set, and use central tendencies to...
Curated OER
DATA ANALYSIS OF GROUND LEVEL OZONE
Sixth graders construct and interpret graphs from ozone data collected in the Phoenix area.
Shodor Education Foundation
Graphing and the Coordinate Plane
Ready to introduce your class to the coordinate plane? This website includes a detailed lesson plan that includes two interactive games to help learners practice graphing ordered pairs. The scripted discussion is a little cheesy and a...
Curated OER
Coming to Know F and C
Students collect temperatures using a probe and examine data. In this temperature lesson students complete an activity using a graphing calculator.
Curated OER
Fire Wars
Your class can practice collecting and analyzing data. They extrapolate information and derive data from fire season statistics. They also choose the most appropriate format to display collected data.
Curated OER
Time Management
Young scholars record their daily activities and graph the results using the educational software program called Inspiration. This lesson is intended for the upper-elementary classroom and includes resource links and activity extensions.
Curated OER
Funerals and Burial Rites
Ninth graders research burial practices that originated in West Africa and then migrated to the South Carolina and Ohio. They compare and contrast burial practices in both places. As students collect information and data, they organize...
Curated OER
Survey and Share
Students practice collecting data by surveying other students. In this data collection lesson plan, students decide on a question and collects data from 15 other students. Eventually the students will end up graphing their results.
Curated OER
Icebergs: Relationship of Ice to Water
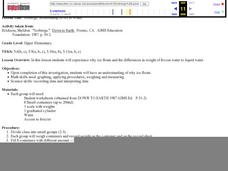
Students experience why ice floats and the differences in weight of frozen water to liquid water. Students explore why ice floats. They use math skills such as: graphing, applying procedures, weighing and measuring. Students also use...
Curated OER
Predicting Monthly Precipitation
Students should log onto, and collect data from, a specific site on the Internet. They average and compare the data using the Excel spreadsheet program, make predictions from their data, and determine the percent error of their predictions.


