Curated OER
Biological and Agricultural Engineering
Eighth graders explore mathematics by conducting a series of investigations using a colorimeter. In this math lesson, 8th graders explain the purpose of food irradiation. They collect data and graph them.
Curated OER
Graphing Iron Data
Students apply a data set to create a graph show how iron ore impacts an ecosystem. They explain how the iron effects the distribution and abundance of phytoplankton in coastal ecosystems using spreadsheet software.
Curated OER
Bias in Statistics
Students work to develop surveys and collect data. They display the data using circle graphs, histograms, box and whisker plots, and scatter plots. Students use multimedia tools to develop a visual presentation to display their data.
Curated OER
Graphing Pendulum Results
Sixth graders set up a pendulum experiment deciding which variable to manipulate (length of string or weight on the string). They create a hypothesis, collect necessary equipment, and write out each step of their experiment. They then...
Curated OER
What Are We Listening To?
Students gather data from a web site on number of music albums sold by genre for the last two years. They convert these figures to fractions, decimals, and percents, and display the results in bar graphs and pie charts.
Curated OER
Lahar Travel Time
Ninth graders analyze published geologic hazard maps of California and comprehend how to use the map's information to identify evidence of geologic events of the past and present and predict geologic changes in the future. They select...
Curated OER
Probability Experiment Simulation: Design and Data Analysis Using a Graphing Calculator
Seventh graders simulate probability experiments. Using a graphing calculator, 7th graders design, conduct, and draw conclusions from simulations or probability experiments. Students construct frequency tables and compare the...
Curated OER
Getting There
Young scholars practice reading a pictograph. In this data analysis lesson, students collect data and create their own pictograph. A young scholars worksheet is included.
Virginia Department of Education
Transformation Investigation
Graph it! Investigate transformations with a graphing calculator. Pupils graph sets of linear functions on the same set of axes. They determine how changes in the equation of a linear function result in changes in the graph.
Curated OER
Effects of Temperature, Deviation on Climate
Young scholars collect and record data for a given city. They calculate standard deviation of temperature and analyze the impact of climate changes on a city's and culture.
Curated OER
Creating Circle Graphs with Microsoft Excel
Seventh graders will learn how to construct circle graphs using paper and pencil. Then they will learn how to construct circle graphs using Microsoft Excel. This lesson uses technology and shows learners how to cross skills into the...
Curated OER
Observing the Evidence
Fifth graders explore how to do research from a large group. They explore how to choose a representative sample and collect data from it.
Curated OER
Aerosol Lesson: Science - Graphing SAGE II Data
Students examine and plot atmospheric data on bar graphs.
Curated OER
Graphing Calculator Activity: Multiplying and Dividing Mixed Numbers
In this graphing calculator learning exercise, students explore necessary steps to multiply and divide mixed numbers using a graphing calculator. In groups, students measure objects in their classroom and write equations using their...
Curated OER
Graphing Your Favorite Pizza Topping
Fifth graders can survey the students just in their classroom, the grade level, or other grade levels. Upon finishing the surveys and compiling the data, the students can input their results in an Excel template or create their own...
Curated OER
What Color Are Your Eyes?
In this color of eyes activity, students conduct a survey to determine the number of students who have brown, hazel, blue or green eyes. The information is collected and then the data is organized. Students may use the data to create...
Curated OER
Graph and Compare the Adventure's Temperature Vs. Local Temperature
Students explore the concept graphing data. In this graphing data lesson, students use weather data from their local weather and some other city and graph them. Students plot the local weather vs. another city. Students record...
Curated OER
Science: Backyard Bugs Data Collection
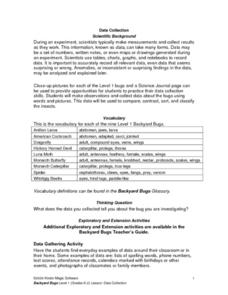
Students practice data collection skills by observing common bugs found in their local environment. Once the data is collected they complete data sheets to compare, contrast, sort, and classify the insects. The lesson includes...
Curated OER
Getting Graphs: Researching Genealogy-A Piece of Pie
Third graders research their genealogy. In this math lesson, 3rd graders collect data and create graphs and charts. A presentation of their findings is given.
Curated OER
Do new kinds of insects appear after soil modification?
Students explore and experiment with the concept do new kinds of insects appear after soil modification. They assess and review scientific methods of observation, predicting, variables, math skills, ratio, proportions, graphs and the art...
Curated OER
Voter Turnout
Explore politics by analyzing the voting process. Pupils discuss the purpose of casting votes in an election, then examine graphs based on the data from a previously held election's turnout. The instructional activity concludes as they...
Polar Trec
Ozone Data Comparison over the South Pole
Did you know the hole in the ozone is seasonal and filled by January every year? The lesson uses scientific measurements of the ozone over the South Pole to understand patterns. Scholars learn that the hole grew bigger annually before...
Curated OER
Trends of Snow Cover and Temperature in Alaska
Students gather historical snow cover and temperature data from the MY NASA DATA Web site. They compare this data to data gathered using ground measurements from the ALISON Web site for Shageluk Lake. They graph both sets of data and...
Curated OER
Acceleration Lab
Young Einsteins experiment with the acceleration of Hot Wheels™ toy cars down inclined planes at various angles. This classic physics lab activity is thoroughly explained in both a teacher’s guide and a student lab sheet. Science...


