Curated OER
It's OK to Reach Your Boiling Point!
Students view a video which introduces them to density and the states of matter. They experiment, collect data, and graph the boiling/freezing points of several edible items...and then make brownies!
Curated OER
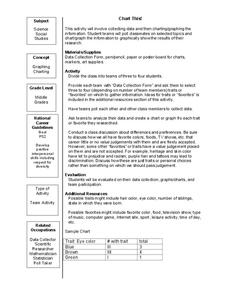
Chart This!
Students collect data and graph or chart the information. In this data organization lesson, students poll their classmates about certain topics and chart or graph the information to show the results of their research.
Curated OER
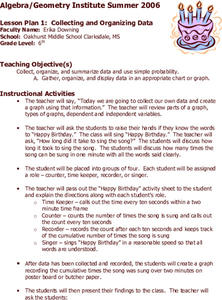
Collecting and Organizing Data
Sixth graders practice collecting and organizing data. In groups, 6th graders determine how many times "Happy Birthday" (at a reasonable rate) may be sung in ten seconds. They collect the information and create a graph.
Curated OER
Scientific Investigation- Magnets
Students conduct a scientific investigation to determine if a magnet attracts paper clips through different materials. Students write out their procedures, collect data and present it in a table or chart, and analyze their results.
Curated OER
Ghostbusting in the Chesapeake
Ghost pots, fishing gear lost during crabbing expeditions, continue to trap crabs that are never collected. Increase your budding ecologists' awareness of human impact on the environment as well as conservation efforts using this...
Curated OER
Awesome Animals
Students collect data from classmates about their favorite animal. They use the ClarisWorks graphing program to enter data, graph results, and interpret data.
Curated OER
Unit 2: Lesson 7
Students are introduced to spreadsheets. They conduct a survey of television viewing time of different shows based on different age categories. Students work in small groups. They collect, data and interpret the data from a survey.
Curated OER
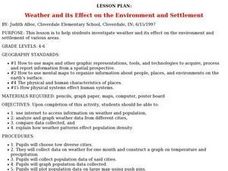
Weather and its Effect on the Environment and Settlement
Students, after choosing two diverse cities, collect data on weather for a month and construct a graph on temperature and precipitation. After collecting population data of said cities, and graphing it, they plot population on a large...
Curated OER
Confusing Colors!
Fourth graders collect data, graph their data, and then make predictions based upon their findings. They's interest is maintained by the interesting way the data is collected. The data collection experiment is from the psychology work of...
Curated OER
Bones and Math
students identify and explore the connection between math and the bones of the human body. Students collect data about bones from their classmates and from adults, apply formulas that relate this data to a person's height, and organize...
Curated OER
The M&M's Brand Chocolate Candies Counting Book
First graders use estimation skills and gather data and record their findings
Curated OER
Graphing Data on Ellis Island
Third graders use data to make a bar graph. In this graphing and social studies lesson, 3rd graders use data about where Ellis Island immigrants came from to complete a bar graph on Microsoft Excel.
Curated OER
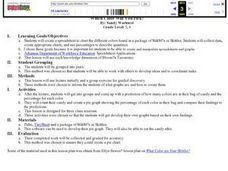
Which Color Will You Pick?
Students create a spreadsheet to chart the different colors found in a package of M&M's or Skittles. They collect data, create appropriate charts, and use percentages to describe quantities.
Curated OER
Closing the Case
Fifth graders collect data and prepare data displays using a survey with statistical information.
Curated OER
Our Animal Friends
Students use the internet to find information pertaining to the benefits of pets. They list their results on a database. They find and record data on the percent of households that own pets as well as the top six species of pets. Once...
Curated OER
Collect Your Own Drosophila Lab
Students study Drosophila by catching them. They construct catcher-containers to catch Drosophila using fruit as bait. After collection, they examine the flies and collect data to be displayed.
Curated OER
Recording Frequency
First graders analyze nursery rhymes and gather data about word frequency. In this frequency lesson, 1st graders create graphs and tables. Students interpret the data.
Curated OER
Scientific Method- "The Big Ahah"
Students experiment with water, dropper and a coin to study the scientific method. In this scientific method lesson plan, students are in groups, each with a coin, water and a dropper. They investigate how many drops of water can fit on...
Curated OER
Rhinos and M&M's
Students analyze patterns of exponential models by collecting data in paper folding and M&M investigations. They use graphing calculators to create scatter plots that lead to equations for the exponential models. They then apply this...
Curated OER
Energy and Changes of State
Students complete a variety of labs to help them explain how energy affects the changes in states of matter. They also be required to collect and record data, graph data, and apply interpretations of that data.
Curated OER
Infusing Equity Gender into the Classroom
Students investigate if gender makes a difference in the classroom. In this statistics lesson, students collect data on whether equity by gender in the classroom makes students more successful.
Curated OER
What Would Make Our School More "Green"?
Students survey their school to get ideas for how to make the school more environmentally friendly. In this environmental lesson plan, students collect data from other students and teachers. They use the data to create graphs and present...
Curated OER
Plant Systems
Second graders learn about plant systems and how plants grow and function. In this plant lesson plan, 2nd graders collect data based on roots, leaves, terrariums, plant uses, and locations of certain kinds of plants. They fill out...
Curated OER
Polluting the Environment
Fourth graders construct mini-ecosystem, pollute the ecosystem, observe, collect, and record data on the effects of these pollutants on their ecosystem, organize data on spreadsheets, create graphs, and design presentations to share with...


