NASA
Newton Car
If a car gets heavier, it goes farther? By running an activity several times, teams experience Newton's Second Law of Motion. The teams vary the amount of weight they catapult off a wooden block car and record the distance the car...
Super Duper Publications
WH Question Cards - Pro: Who, What, When, Where, Why
Do you have kids on your caseload with wh questions goals, that need extra practice comprehending and asking who, what, when, where, and why questions? Then this clever app is designed for you!
Intel
Play Ball!
Math and sports meet on the baseball diamond in the first STEM lesson in a series of six that asks pupils to collect and perform comparative analyses of data specific to baseball. Following the analysis, scholars create a presentation...
Towson University
It's a Gassy World!
How much does your class know about the relationship between climate change and carbon dioxide? Science scholars explore the nature of greenhouse gases and rising ocean temperature through demonstrations, research, and experiments. The...
101 Questions
Gas Station Ripoff
Ever wonder if you can trust the pump that pumps your gas? Budding mathematicians use video evidence to analyze the cost-per-gallon ratio at different intervals for three different pumps. Their goal is to identify the pump that is...
Curated OER
Ozone and Temperature Data Analysis, South Pole Antarctica
Students discuss the layers of the atmosphere, and the history of the ozone hole. They discuss the chemistry of the ozone formation. Students compare seasonal data collected with ozonesondes. They compare Antarctic and Arctic ozone hole...
Curated OER
Farm Stories, Animal Webbing, Favorite Farm Animal Graph
Students brainstorm animals they would expect to see on a farm. They save these on a Kidspiration web. Students watch or read a farm story. They discuss the characters. Students vote for their favorite farm animal and crate a graph using...
Curated OER
Using GLOBE Data to Study the Earth System (College Level)
Students use the GLOBE Website to locate and study environmental data. They use the GLOBE Graphing Tool to display data. Students describe the role of solar energy in the annual fluctuations of soil moisture. They describe reservoirs and...
Curated OER
Bar Graphs and Pie Charts
Students graph data they collected and analyze it using a bar graph. In this algebra activity, students analyze their data using pie charts and bar graphs while explaining the meaning to each other. They compare and contrast bar...
Curated OER
Collecting Ball Bounce Data
Learners investigate quadratic equations as they use a CBR to collect and analyze data regarding a bouncing ball. Pupils explore different methods for determining the equation of the parabolic path including quadratic regression and...
Curated OER
Graphs and Measurement
Tenth graders analyze graphs and by comparing trees. In this geometry lesson, 10th graders investigate the use of different graphs using bar and regular graphs. They work groups at the computer.
Curated OER
Graphing Linear Equations
Ninth graders review the information that they have already learned
with regard to linear equations and graphical representations. They then assist in combining equations with a graphical element and complete various graphs with this...
Curated OER
Comparing Linear and Exponential Data
Learners graph linear and exponential equations. In this algebra instructional activity, students differentiate between linear and exponential equations. They relate it to the real world.
Curated OER
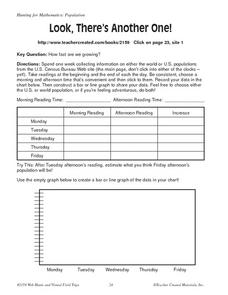
Look, There's Another One!
In this math worksheet, learners spend a week collecting information on either the word or U.S. populations from the U.S. Census Bureau Web site. Students record their data in a chart and bar graph. Learners also use the website to...
Curated OER
Weather, Weather, Everywhere!
Sixth graders collect weather data to compare temperatures around the world. Using the Internet, learners collect data, put it into spreadsheets, and analyze and graph the results. An interesting way to cover the topic of weather.
Curated OER
A Sweet Drink
Students investigate reaction rates. In this seventh or eighth grade mathematics lesson, students collect, record, and analyze data regarding how the temperature of water affects the dissolving time of a sugar cube. Studetns determin...
Curated OER
Examine Methods of Reporting Research Results
Students analyze a research report and the list of components needed in a research report and then identify those components based on a set of standards using the scientific method. They collect data which can be used for a graphical...
Curated OER
Pumpkin Problems
Students participate in a lesson that has the intention of working on estimation skills. They use pumpkins to estimate the number of seeds are inside. They collect data for each pumpkin and compare it to the estimation. Students question...
Curated OER
Get Ready For Some Football
Sixth graders compare and contrast the totals from two national football teams for the year. Using the internet, they search for the information they need and create a data bar graph. They use the information they collected to answer...
Curated OER
What Are You Eating?
Discover the calorie content of foods by observing how much heat they produce in water. If you have a calculator-based laboratory (CBL™) insturment for collecting data, then this laboratory worksheet will not need any changes. If not,...
Curated OER
Graph It!
First graders use organized data to construct real object graphs, picture graphs, and bar-type graphs.
Curated OER
Data Days
Sixth graders practice collecting, organizing and displaying data. They create circle, bar, line and picto graphs. They analyze data in small and large sample groups.
Curated OER
Graphing Pockets
Second graders explore graphing. They count the number of pockets on their clothes and use Microsoft Excel to enter their data. Students create a class graph displaying their findings.
Curated OER
Viewing Tubes
Middle schoolers complete a lab in order to discover if the length of a viewing tube, its diameter, or the distance from an object affect the type of data collected and the resulting graph.


