Curated OER
Chucky Chickadee's Bird and Breakfast: Sing in Please
Students observe bird feeding and complete a tally and graphing activity for their observations. In this bird graphing lesson plan, students work in teams to observe bird feedings. Students complete a bird reporting sheet and collect...
Curated OER
Weather
Second graders study the basic components of weather. They construct a thermometer and anemometer to measure temperatures, precipitation, and wind speed. In addition, 2nd graders discover how to find these components on weather maps.
Curated OER
Phenomenal Weather-Related Statistics
Eighth graders research, collect and interpret data about weather statistics. They record that data on spreadsheets. they create Powerpoint presentations on their individual or group research.
Curated OER
Texas Weather Report
Students use provided links to observe selected weather sites and collect temperature and precipitation data for listed cities. They enter the information onto their spreadsheet. Students study maps of the Texas natural reagions,...
Curated OER
Weather Log
Learners develop the skill of recording weather observations. Not only students be responsible for recording visual observations of the sky, but also collecting and recording weather instrument data.
Curated OER
Comparing Weather Conditions
Students conduct research on temperature, wind speed and weather conditions from a variety of areas. They organize their findings on worksheets and spreadsheets and discuss various examples of databases.
Curated OER
Newspaper Weather
Learners use their knowledge of the weather to evaluate information from the newspaper. They also take this knowledge and construct a weather map predicting the next day's weather.
Curated OER
How Is The Weather?
Studemts explore the purpose of this activity is to make a prediction of the weather in Australia based on prior knowledge. They use technology to help determine if the prediction is correct. Learners will discuss the difference between...
Curated OER
How Is The Weather?
Learners engage in the purpose of this activity is to make a prediction of the weather in Australia based on prior knowledge. To use technology to help determine if the prediction is correct. Students will discussthe difference between...
Curated OER
A Comparison of Cloud Coverage over Africa
Young scholars identify different climate regions and local weather patterns. For this cloud coverage lesson students use NASA satellite data and import it into Excel.
Curated OER
Measuring the Wind 1
In this science worksheet, students follow the directions and construct a simple instrument to measure the speed of the wind. Students then measure the wind speed and record data for one school week. On other pages students construct a...
Curated OER
Design Weather Instruments using LEGO Sensors
Students design and create a LEGO structure that will house and protect a temperature sensor. They leave the structure in a safe spot and check the temperature regularly and chart it. After the students have built their structures, the...
Curated OER
The Clouds Tell All
Students examine the different types of clouds and how they form. They are to create their own weather forecast based on their observations of clouds in their area. Questions are asked for comprehension to end the lesson.
Curated OER
El Nino Lesson
Students compare graphs of weather occurrences. In this environmental lesson plan, students will being using the website to gather weather related information for a certain time period. The students will then graph the data that will be...
Curated OER
Basic Excel
Students explore basic Excel spreadsheets. In this spreadsheet lesson plan, students enter Alaska weather information and perform calculations. Students title the columns on the spreadsheet and format the cells. Students complete...
National Wildlife Federation
Climate Solutions – A Call to Action!
The final lesson in the 21-part series on climate change focuses on energy solutions to the consumption problem. Using data specific to their school, pupils make recommendations, follow up on actions, and carefully track progress....
Curated OER
Graphing the Forecast - Line Graph or Bar Graph?
Sixth graders compare and contrast bar and line graphs. Using a weather forecast of the area, 6th graders record the high and low temperatures in a table. Students determine and justify the most appropriate graph to display a given set...
US Environmental Protection Agency
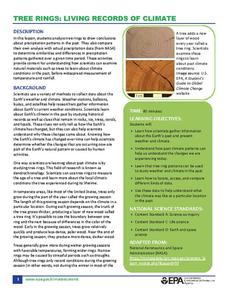
Tree Rings: Living Records of Climate
Open with a discussion on weather and climate and then explain how tree rings can provide scientists with information about the earth's past climate. Pupils analyze graphics of simulated tree rings from various US locations for the...
Curated OER
What Goes Up Must Come Down!!
Fifth graders look at actual sunrise and sunset times for their hometown to determine a pattern in the amount of daylight. They collect their data in Excel and create a chart to help them identify the pattern, then write an explanation...
NOAA
El Niño
El Nino, La Nina ... and the Santa Maria? The 11th installment of a 23-part NOAA Enrichment in Marine sciences and Oceanography (NEMO) program explains the mechanism of El Nino/Southern Oscillation. Pupils use previous data to determine...
Curated OER
Trends of Snow Cover and Temperature in Alaska
Students compare NASA satellite data observations with student surface measurements of snow cover and temperature. They practice data collection, data correlations, and making scientific predictions.
Curated OER
Meteorological Predictions
Students make a link between prediction and hypothesis in math and science. Based on data collected over one week, students evaluate the predictions of local weather forecasters, compare the predicted outcomes to the actual weather...
Curated OER
Observing Fall Migrants
Pupils observe the migration of monarch butterflies. They collect data regarding the number of monarchs they see, the location, the butterflies' behavior, the temperature and the date and time. Then they send their data to a university...
Teach Engineering
Pointing at Maximum Power for PV
Following detailed directions, teams collect the voltage and current outputs of a photovoltaic cell by adjusting the resistance. Using the collected data, they determine the highest power output. Implications for weather and a large...


