Illustrative Mathematics
Telling a Story With Graphs
Turn your algebra learners into meteorologists. High schoolers are given three graphs that contain information about the weather in Santa Rosa, California during the month of February, 2012. Graph one shows temperatures, graph two...
EngageNY
Relationships Between Two Numerical Variables
Is there another way to view whether the data is linear or not? Class members work alone and in pairs to create scatter plots in order to determine whether there is a linear pattern or not. The exit ticket provides a quick way to...
National Wildlife Federation
Branching Out – Exploring Dendrochronology
Tree rings from North America give a continuous history of El Nino intensity over the last 1,100 years. Scholars learn how scientists use tree rings to create timelines demonstrating variations in weather patterns. The cumulative...
Pulitzer Center
The Global Water Crisis
High schoolers examine the "quiet crisis," the lack of clean water, by reading articles and viewing video clips. They discuss the situations in Ethiopia, Yemen, Kenya, and Nepal. There are two options for the lesson, but one of them...
Curated OER
Natural Selection
Kids act as scientists and preditors in this short natural selection activity; they collect and analyze data, then apply their new knowledge to real-world examples of natural selection. The layout of the worksheet is easy enough to use...
Curated OER
Weather Conditions During the Spring Monarch Migration
High schoolers keep a detailed record of weather patterns during the spring migration of the monarch butterfly. The use of weather reports is used to form a class data sheet. This lesson connects to the skills of graphing and critical...
Curated OER
Forecast Fever
Ninth graders investigate what high-tech tools are used to gather weather data and make weather forecasts. They view a video and a PowerPoint presentation, and conduct research on a cloud chart website. Students make local weather...
Curated OER
Weather Chart
Students select at least 6 cities from around the world to keep track of their high and low temperatures over a period of time.
Curated OER
Highs and Lows
Students use email to chart weather patterns and then graph their findings. In this weather patterns lesson, students chart their weather for a week at the school. Students then use email to find temperatures at a variety of locations....
Curated OER
Graph and Compare the Adventure's Temperature Vs. Local Temperature
Students explore the concept graphing data. In this graphing data lesson, students use weather data from their local weather and some other city and graph them. Students plot the local weather vs. another city. Students record...
Curated OER
Weather Whys- Cloud Watching Journal
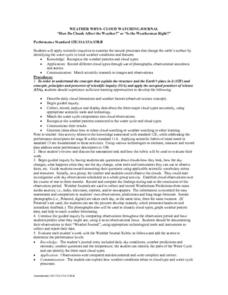
Learners examine how natural processes change the earth by identifying their local water cycle. Individual students complete a cloud journal over a specific period of time. They observe clouds daily and take photographs of the clouds...
Curated OER
Meteorology
Fourth graders study how atmospheric conditions change while naming the things that make the weather change. They investigate the affects of air masses, weather fronts and high/low pressure by looking at weather maps from newspapers.
Curated OER
Up, Up, and Away
Fifth graders participate in a WebQuest that introduces them to a study on clouds and how they relate to weather systems.
Curated OER
Curricular Correlations
Here is a terrific way to teach your oceanographers about the effects that the ocean have on the weather and climate found throughout the world. In it, pupils engage in a science experiment designed to emulate how the ocean affects...
Curated OER
Agriculture, Weather, Economy and Indiana
Fourth graders, in groups, investigate the role of weather in Indiana's farming economy. They make a prediction as to weather and its effect on the economy of Indiana. They present their data using a media presentation of data...
Curated OER
Weather Variables Lab
High schoolers examine what happens when air temperature drops and gets closer to the dewpoint. They perform a lab activity which illustrates the effects on humidity, precipitation and barometric air pressure.
Curated OER
Graphing Data - Temperature
Seventh graders measure and record temperature over a given time period. They compare the recorded temperatures to the 40-year recorded normal average temperatures for the same area. Students display and interpret their findings in a graph.
Curated OER
Weather Everywhere
Students gain an understanding of how meteorology affects our physical world and our lives. They utilize resources on web-based activities and participate in the classroom activities to enrich their understanding.
Curated OER
Make Your Own "Weather" Map
High schoolers create their own "weather" map using data from x-ray sources. They analyze and discuss why it is important to organize data in a fashion in which is easy to read. They compare and contrast different x-ray sources using a...
Curated OER
Using Imported Data in Excel
Students import atmospheric data from the internet. In this earth science lesson, students graph the data they collected. They complete the worksheet after the activity.
Curated OER
How Do Storms Influence Our Lives?
Students investigate the various ways storms influence our lives. They conduct Internet research, identify the characteristics of different storms, plot storm coordinates, and write a report on a particular storm.
Curated OER
Crimes on the Great Lakes
Students solve simulated crimes using real-time online information. They research data on items such as ship tracking through GPS, lake conditions, and weather systems. They also collect information about invasive plant and animal...
Curated OER
Learning Lesson: Measure the Pressure II -- The "Dry" Barometer
Pupils use simple items to create their own aneroid barometer. They have five days to build it and ten days to observe and collect data. They examine tornado safety tips to end the instructional activity.
Curated OER
Learning Lesson: Measure the Pressure -- The "Wet" Barometer
Young scholars use simple objects to create their own barometer. They have five days to build it and ten days to observe and collect data. They examine thunderstorm safety tips to end the lesson.


