Curated OER
Frogs: Fact or Folklore
Students discover how frogs are adapted to their environment. They view and discuss a Discovery Channel video on frogs and the myths surrounding frogs. In small, groups they compile data on frogs from the internet to create a Frog Fact...
Curated OER
Which reference book helps most?
Fourth graders utilize various reference materials to find specific types of information. In this library research lesson, 4th graders choose the best source of information from the library's reference collection to answer questions.
Curated OER
Let's Take a Chance!
Students investigate probability and the chance of an even happening. In this algebra lesson, students incorporate their knowledge of probability to solve problems and relate it to the real world. They learn to make decisions based on data.
Curated OER
Probability
Sixth graders explore the concept of probability. In this probability lesson, 6th graders collaborate to collect spinner data based on the likelihood of spinning odd and even numbers. Students complete 2 other probability activities and...
Curated OER
Sunrise/Sunset
Pupils apply data from a weather-related website to predict patterns in the sunrise and sunset.
Curated OER
CSI Clamshell Investigation
Students explore predator/prey relationships. They research information on moon snails and claims. Students draw conclusions from the data collected. They use math and graphing to determine if there is a relationship to the clam's size...
Curated OER
Cloud Database
Students research information on the types of clouds. They create a database and use a formula. They create various reports and access electronic information to obtain accurate pressure and temperature readings from the National Weather...
Curated OER
Tech Algebra: A Statistics Study
Students use the internet to gather a minimum of thirty pieces of data. Students create box and whisker graphs, and stem and leaf plots from the information. They calculate mean, median, mode, and range. Students write a summary and...
Curated OER
Geography of Korea
Students are introduced to the geography of Korea. Using the internet, they identify the weather and climate in the country and create a week weather chart for Korea's four seasons. They complete an interview with a local weatherman...
Curated OER
Detecting Magnetic Materials in "Martian" Soil
Students simulate some of the Pathfinder experiments by devising methods of collecting and measuring magnetic substances in pseudo-Martian soil. The efficiency of each of the methods used to collect materials is evaluated in this lesson.
Curated OER
Blowing in the Wind
Pupils compare hurricanes and tornadoes. They write a paragraph explaining how to prepare for a storm. Students give an oral report. They use weather facts to practice math skills. Pupils record observations of a storm.
Curated OER
Outdoor Observation
Students examine their outside environment. They use their senses to make observations of the four seasons. They keep a chart of all of the data they have collected.
Curated OER
Under The Sea
Second graders study how a tsunami is formed by underwater events such as earthquakes, volcanoes or landslides. They discuss what they knew about living and non-living things in the ocean.
Curated OER
Will There Be Ozone Tomorrow
Students collect and analyze real time data. They make comparisons and determinations about the status of ozone in their local area and predict the Ozone level for the next day
Curated OER
Teaching about Diel Temperature Variation
Learners explore temperature variation in lakes and deal with the data.
Curated OER
Science: Trouble in the Troposphere
Students research a NASA Website and record information about an assigned city's tropospheric ozone residual monthly climate. In groups, they graph the information for the past year. They form new groups and compare their city's...
Curated OER
Temperature Comparisons
Students practice plotting temperature data points on a line graph in groups and examine the temperature differences at the same time of year. They graph the temperatures in Lannon, WI, and Mitchell's Plain, SA. After the data has been...
Curated OER
Physical Characteristics of the Troposphere
Students lexplore environmental trends in the troposphere- temperature, dew point, pressure and wind speed- by checking their hypotheses against data collected by weather balloons.
Curated OER
Physical Characteristics of the Troposphere
Students examine troposphere graphs and mcompare their hypotheses with data collected by weather balloons launched from the NOAA ship, Ronald H. Brown. they write summaries about the physical properties of the troposphere.
Curated OER
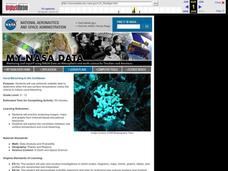
Coral Bleaching in the Caribbean
Students use authentic satellite data on the NASA website to determine when the sea surface temperature meets the criteria to induce coral bleaching.
Curated OER
What is a Cloud
Third graders study clouds and how they are formed. They write acrostic poems about clouds and analyze and graph temperature data collected during varying degrees of cloud cover.
Curated OER
Fahrenheit vs Celsius
Students make a thermometer and write a paragraph about how they did it.
Curated OER
Power In The Wind
Students experiment designing graphs of selected readings from the Nebraska sites from the Power in the Wind study. They choose whether or not to put their data in a spreadsheet program to make a computer-generated graph or to complete...
Curated OER
Temperature Variations and Habitability
Pupils, in groups, evaluate conditions outside the building and inside the classroom using thermometers, barometers, anemometers, etc. They compare interior and exterior conditions. They consider and discuss factors that contribute to...


