Curated OER
Graphing Pasta
Students sort and graph various types of pasta. Using pasta construction paper patterns or real pasta, they sort the pasta by color, size, and type, and record the data on a graph.
Curated OER
Environment: Wild Wind Direction
Students examine the different types of wind patterns. Using common materials, they construct weather vanes to measure and record wind direction over a two-week period. After analyzing the data, they draw conclusions about the...
Curated OER
Using Database to Organize Information
Fifth graders collect information about an assigned topic. They organize data by using a database.
Curated OER
Just Graph It!
Fourth graders evaluate various graphs for the best way to reflect statistical data. They use a spreadsheet to organize data and generate varied graphic representations. They select the graph they feel best shows their results.
Curated OER
Rainforest Realities
Students gather information about the rainforest and the environment from the Internet. They analyze the impact that humans have on the environment. They also collect and organize data they find on the rainforest.
Curated OER
Database Detectives Record Clues
Students collect and organize data from their classmates. They create a database of the information and analyze it. They discuss the role technology has in the world today.
Curated OER
Connecting Math to Our Lives
Students participate in an online interactive forum to explore how math is used in their families and communities. They design games to submit to other students online, and identify and organize data to solve the problems from other...
Curated OER
Lifestyles of the Tribe, or Tomorrowland?
Eighth graders identify with and analyze through writing various Indian cultural values and how they fit in the modern world. Students organize data utilizing Educational software programs and present their opinions and inferences in a...
Curated OER
Can You Measure Up?
Here is a well-designed lesson on common standards of measurement for your young mathematicians. In it, learners calculate measurements in standard and non-standard units. They make predictions, record data, and construct and design...
Curated OER
Do Not Open Until May 2000!
Students create a time capsule. For this time capsule lesson, students collect and record data about themselves to be stored in a time capsule that will be opened at the end of the year.
Curated OER
Aquatic Field Data
Students use laptops and sensors to measure water quality and graph their results. In this aquatics instructional activity students post their results to a website or email.
Curated OER
Cruising the Internet
Students identify the parts of an engine using a graph. In this statistics lesson, students make a graph from their collected data. They calculate the volume of a cylinder using a line of regression and a scatter plot.
Curated OER
Examining Infiltration Rates of Various Soil Types
Students formulate their own hypothesis, determine which variables are important to test their hypothesis, design an experiment in which they collect data. They utilize instruments and tools to measure, calculate, and organize data.
Curated OER
World Statistic Day
Eleventh graders collect data about the state they live in. In this statistics lesson, 11th graders collect and analyze data as they compare themselves to students in other states. They analyze data about a person's education level, and...
Curated OER
Tall Tale Rollers
Students explore American tall tales. In this tall tale lesson, students discover the six characteristics that are included in tall tales. Students survey their class to find each student's favorite tall tale character and organize the...
Curated OER
Geoboard Area
Students explore the basic geometric shapes and geometric shape vocabulary through the use of geoboards and virtual geoboards. They create a variety of shapes with a partner, build ten different rectangles on their geoboards, and...
Curated OER
Fruit Loop Graphing
Fifth graders interpret data and create graphs. Given Fruit Loops, they sort and classify according to color. Using spreadsheet technology, 5th graders record their data and create bar and circle graphs. Students analyze data and...
Curated OER
Pika Chew
Students work in collaborative teams with specific roles, use the Internet to research the behavior and ecology of pikas, make predictions about survival rates of pikas in different habitats and organize their data in graphs.
Curated OER
One, Two, Three...and They're Off
Students make origami frogs to race. After the race they measure the distance raced, collect the data, enter it into a chart. They then find the mean, median, and mode of the data. Next, students enter this data into Excel at which time...
Curated OER
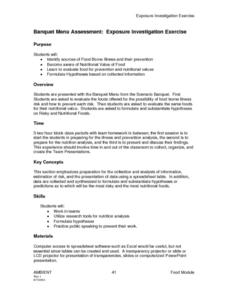
Banquet Menu Assessment: Exposure Investigation Exercise
Learners identify sources of Food Borne illness and their prevention. They formulate hypotheses based on collected information. Pupils become aware of Nutrintional value of food. Students collected data are synthesized to formulate...
Mathematics TEKS Toolkit
Grade 6: Exploring c/d = pi
Introduce your math class to the perimeter of a circle. Teach them that pi describes the relationship between the circumference and the diameter. As a hands-on investigation, pairs or small groups use string to compare these two values...
Curated OER
Food Classification
Students are introduced to classification and some of the difficulties surrounding classification and how classification systems need to be able to adapt and how they may need to be changed when new information is discovered. They...
Curated OER
Box-and-Whisker Plots
Eighth graders measure in feet and inches and convert to explore the relationship between the converted measurements. In this measurement lesson plan, 8th graders use the whisker and box plot to represent the measurement of a cat. ...
Curated OER
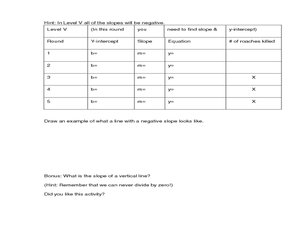
Cockroach Slope
Students identify the slope of linear functions. In this slope lesson, students collect data and graph it. They write equations with no more than two variables and use technology to explain their data.


