Curated OER
An Investigative Task
Learners read an article about statistics. In this statistics lesson, students are given a detailed overview about statistics and what it entails. This lesson is more informational and hands on.
Curated OER
Graphosaurus
Students complete bar graphing activities with a dinosaur theme. Students discuss their favorite dinosaurs, collect data about the discussion, and make a floor graph of the information. Students complete a dinosaur graph worksheet.
Curated OER
School-Wide Recycling
Students investigate recycling. In this environmental lesson, students design a recycling program for their school. Students collect data about how much recyclable materials they use in one week. Students also survey classmates about how...
Curated OER
Alphabet Study
Fifth graders predict what they believe the five most common letters are in the English language. After sharing their predictions in a group, they develop a new list of the most common letters used. Using a book, they count the number...
Curated OER
Education for Global Peace
Students survey the class and graph the results. In this graphing and data collection lesson, students conduct a survey to see where their shirts were produced. Individuals use software to graph the results and create a written...
Curated OER
Box Plots on the TI-83 Calculator
Eighth graders research box plots on the Internet. They gather real life statistics and analyze the collected statistics by making multiple box plots on the TI-83 calculator.
Curated OER
Putting Your Best Foot Forward
Third graders measure their feet and their parents' feet, record data on computer-generated graphs, and calculate and record mean, median, and mode.
Curated OER
Weather Watch
Young scholars complete a series of lessons in which they study daily weather patterns and examine extreme weather conditions. They complete activities that range from visual observation of daily weather to building a weather station and...
Curated OER
Shake, Rattle & Roll
Students examine soil. For this science lesson, students examine the layers of soil. Students collect soil from various locations and separate the layers. Students record and chart their findings.
Curated OER
Who Does the Lottery Benefit?
Students investigate the pros and cons of the lottery. In this algebra lesson, students use the formulas for permutation and combination to test their arguments about the lottery. They collect data about their argument and plot it on a...
Curated OER
Forensics 101
Students interpret how to communicate information and ideas in ways that are appropriate to the purpose and audience through spoken, written, and graphic means of expression. They use information-gathering techniques, analyze and...
Curated OER
Radon Alert: Understanding Odds
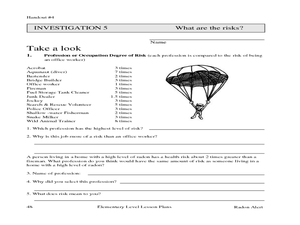
In this radon alert: understanding odds worksheet, 5th graders predict results of rolling dice and record data in a chart, then compare odds of events and occupations, then compare that with radon exposure.
Curated OER
RISKY BUSINESS--OR NOT!
Students learn about the importance and risk that stocks carry within a business. In this financial management lesson, students use role play and case scenario situations to decide what stocks are best for given companies. Based on the...
Curated OER
Up, Up and Away with the Montgolfier Balloon
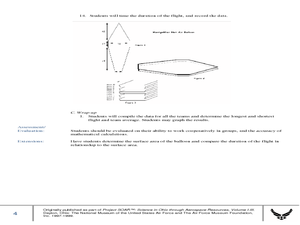
Young scholars construct hot air balloons. For this science lesson, students assemble their own balloon using tissue paper and glue. They time the duration of the flight, record data and calculate team averages.
Pennsylvania Department of Education
Up on Top
Students make bar graphs and identify items in the bar graphs as being likely, certain, or impossible. In this bar graphs lesson plan, students answer questions about the bar graphs using reasoning and communication skills.
Curated OER
Parts of a Whole
Fourth graders explore fractions through the analysis of various paintings. They view and discuss paintings by Picasso and Seurat, discuss the fractional examples in the paintings, and create a bar graph.
Curated OER
3-D Beginning Graphs
Students explore the concept of big and small. They collect objects from the classroom, sort them by size, and create a graph using Duplo stacking blocks.
Curated OER
Parachutes: Is it Surface Area or Shape?
Young scholars investigate how to make a good parachute. In this physics activity, students observe the motion of parachutes as it falls and measure the time. They collect data and calculate the average descent time for each canopy shape.
Curated OER
Water Resources
Learners explore the differences between surface water and ground water. They collect data using maps and graphs and investigate a Texas river basin and a nearby aquifer. They complete a written report of their findings regarding the...
Curated OER
Getting Graphs: Researching Genealogy-A Piece of Pie
Third graders research their genealogy. In this math lesson, 3rd graders collect data and create graphs and charts. A presentation of their findings is given.
Curated OER
And Around We Go!
Sixth graders conduct a survey and collect data to construct a bar graph that will then be changed into a circle graph. With the bar graph, 6th graders compare estimated fractions and percentages and estimate percentages. With the circle...
Curated OER
Tag It and Bag It: Archeology Lab Lesson
Seventh graders practice analyzing, collecting and categorizing artifacts. Using charts, they organize and interpret information about the artifacts they classified. They work together to create a graph to represent class totals and...
Serendip
Homeostasis and Negative Feedback – Concepts and Breathing Experiments
More asthma attacks happen at higher altitudes, but why? Scholars complete worksheets, learning about homeostasis and feedback related to breathing. Then, they work in small groups to experiment with breathing in limited amounts of...
Curated OER
Knead Dough?
Learners make bread and understand that bread gives us energy. For this bread lesson plan, students read the story A Trip to the Market, and learn about the importance of bread. Then they make the bread!


