Curated OER
Bugs, Bugs, Everywhere!
Students collect and compare bugs using magnifying lenses and graph data based on their comparisons. In this bugs lesson plan, students also make an aspirator by using a jar, tubing, and screen.
Curated OER
Energy Content of Foods
Learners collect data, organize and analyze the data and compare it to real life scenarios. This assignment requires two class periods.
Curated OER
Playing With Probability
Students rotate through work stations where they compute problems of theoretical and experimental probability. In this probability lesson plan, students use simulations of a lottery system.
Curated OER
Grade 5: Alphabet Frequency
Fifth graders collect and organize data from writing samples, use fractions and decimals to describe the experimental data, and use the experimental results to make predictions about the frequency of letter usage in the English language.
Curated OER
Probability Distributions
Students collect and plot data on a graph. In this statistics lesson, students analyze the distribution of a sample and predict the outcome. They find the line of best fit and discuss what would make the sample larger.
NASA
Newton Car
If a car gets heavier, it goes farther? By running an activity several times, teams experience Newton's Second Law of Motion. The teams vary the amount of weight they catapult off a wooden block car and record the distance the car...
Curated OER
Probability
Ninth graders engage in a lesson that is about the concept of probability using the context of recording data and predicting outcomes. They collect marbles while recording data and graphing it. The graph is analyzed and ideas are...
Curated OER
Entrance Ticket
Students collect data on different events and word problems. In this algebra lesson, students use a table to organize their data. They graph their coordinate pairs on a coordinate plane and make predictions.
Curated OER
Probability and Statistics
Learners reason mathematically as they solve problems dealing with probability of an even occurring. In this probability lesson plan, students differentiate between different rankings of candidates running for leadership. They identify...
Curated OER
Exploring Probability
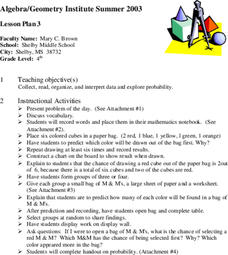
Fourth graders participate in a lesson that explores probability. They use candy and model cubes to experiment with different outcomes that can be charted if the students can proceed to the objective of the lesson. They discover how...
Curated OER
One, Two, Three...and They're Off
Students make origami frogs to race. After the race they measure the distance raced, collect the data, enter it into a chart. They then find the mean, median, and mode of the data. Next, students enter this data into Excel at which time...
Curated OER
Probability and Sports
Students research topics on the internet where probability is relevant. Students study statistics and probability concepts by looking at practical questions that arise in professional sports.
Curated OER
Traffic Light Probability
Students discuss the possible traffic signals that may be observed on the way to a field trip. They record data on the trip, and analyze the probability of the results occurring again.
Curated OER
Fire!, Probability, and Chaos
Students explore the concept of probability. In this probability lesson, students simulate a controlled forest burn using an applet. Students vary the probability of trees burning and predict what will happen.
Curated OER
Probability and Sports
Students explore the concept of probability in sports. In this probability in sports lesson plan, students research a sport that they enjoy. Students find probability information related to their sport. Students share their findings with...
Curated OER
Probability
Fifth graders study probability of events. They predict outcomes, and participate in hands-on experiments to find the probability of specified events. Afterward, 5th graders write probability of events in fractions and decimals.
Curated OER
High Exposure
Students interpret data they receive from the media, discuss possible misinterpretation of data from the media and correctly respond to the misconception quiz question.
Utah Education Network (UEN)
The Human Line Plot
Learners collect data and use charts and line plots to graph the data. Some excellent worksheets and activities are embedded in this fine lesson plan on line plots.
Curated OER
Mathematical Modeling
Study various types of mathematical models in this math lesson plan. Learners calculate the slope to determine the risk in a situation described. They respond to a number of questions and analyze their statistical data. Then, they...
Curated OER
Coin Drop
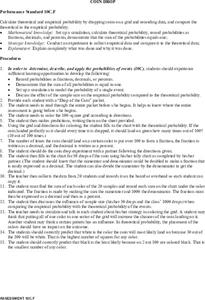
Students calculate the theoretical and empirical probability by dropping coins on a grid. They record their data and compare the theoretical and empirical data. Students make predictions about the results before conducting the experiment.
Curated OER
Paper Tower Challenge
Student explore the challenge of building a tower using paper. They build their tower using paper and record the height of their tower. Students collect and record the heights of other towers and use that data to create a spreadsheet.
Curated OER
Atlatl Lessons for Grade 7
Seventh graders examine force and motion. In this seventh grade mathematics/science lesson, 7th graders collect and analyze data regarding the use of an atlatl to throw a spear. Students describe and analyze the motion which leads to the...
Curated OER
Probability Using M & M's
Young scholars develop an understanding of probability by sorting bags of M & M's by color and recording the results in percents. The data is entered onto a spreasdsheet and graphed.
Curated OER
Statistics and Probility
Seventh graders collect data and make predictions. In this geometry instructional activity, 7th graders work in tiers collecting data and plotting it. They make inferences and predictions about their collected data.


