Curated OER
Cloud Shadows
Students classify clouds as transparent, translucent or opaque. They conduct an experiment to determine the visual opacity of several classroom objects and then conduct further observations of clouds.
Other
Bright Hub: Technology Used to Collect Weather Data
Technology used to collect weather data employs a number of devices such as satellites and weather balloons to perform a very important function to our daily living; forecasting the weather.
CK-12 Foundation
Ck 12: Earth Science: Collecting Weather Data Study Guide
This comprehensive study guide covers the main terms and concepts needed for an earth science unit on collecting weather data. Review questions are included at the bottom of the study guide.
CK-12 Foundation
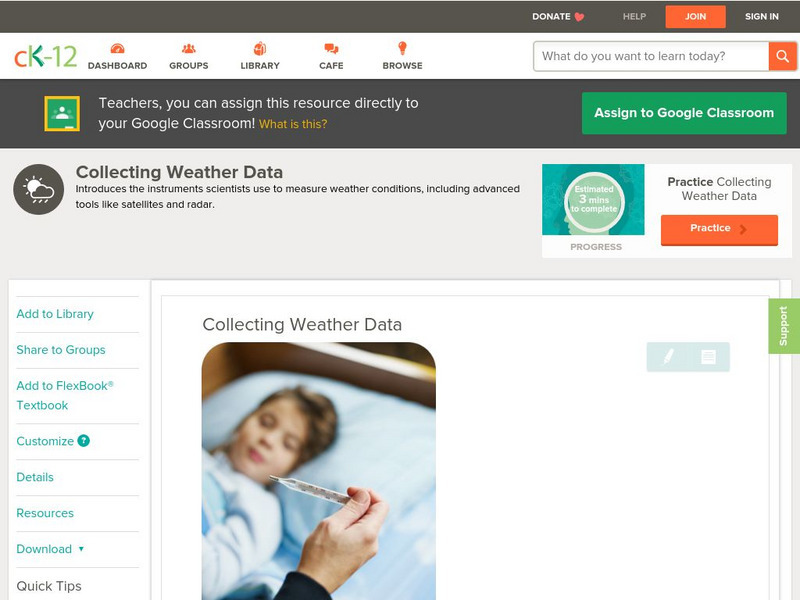
Ck 12: Earth Science: Collecting Weather Data
[Free Registration/Login may be required to access all resource tools.] Describes the various instruments that scientists use to collect weather data.
CK-12 Foundation
Ck 12: Earth Science: Collecting Weather Data
[Free Registration/Login may be required to access all resource tools.] Describes the various instruments that scientists use to collect weather data.
Center for Innovation in Engineering and Science Education, Stevens Institute of Technology
Ciese Real Time Data Projects:collecting Weather Data and Keeping a Weather Log
Over a period of two weeks students will use their class-made instruments to measure and record weather data. Students will also compare their data to online weather data. The final activity involves analyzing the collected data to look...
Utah Education Network
Uen: Trb 4:2 Investigation 7 Interpreting Weather Data
After collecting weather data, 4th graders will interpret it.
Utah Education Network
Uen: Trb 4:2 Investigation 6 Collecting Weather Data
Students will Collect data, then make weather predictions from the weather patterns.
CK-12 Foundation
Ck 12: Earth Science: Collecting Weather Data
[Free Registration/Login may be required to access all resource tools.] Describes the various instruments that scientists use to measure weather conditions, including advanced tools like satellites and radar.
NASA
Nasa: Precipitation Towers: Modeling Weather Data
This lesson uses stacking cubes as a way to graph precipitation data, comparing the precipitation averages and seasonal patterns for several locations. Variations on the lesson can accommodate various ages and ability levels. Students...
Center for Innovation in Engineering and Science Education, Stevens Institute of Technology
Ciese Real Time Data Projects: Weather Scope: A Study of Weather and Climate
Use real-time data to study factors that affect weather and climate, create weather instruments, and share data with students around the world.
Center for Innovation in Engineering and Science Education, Stevens Institute of Technology
Ciese Real Time Data Projects: Building and Using Weather Instruments
In this lesson students will build and learn how to use three weather. They will use these instruments to collect weather data over a period of two weeks.
Center for Innovation in Engineering and Science Education, Stevens Institute of Technology
Ciese Real Time Data Projects: The Stowaway Adventure
Through this series of Internet-based learning experiences and activities, students will use real-time data to track a real ship at sea and monitor weather conditions. Includes a teacher's guide with problem-solving lesson plans...
Illustrative Mathematics
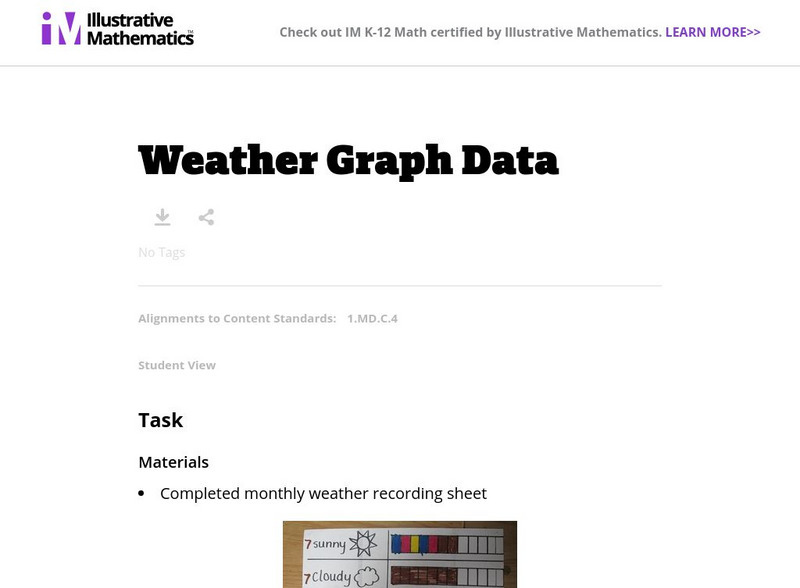
Illustrative Mathematics: Weather Graph Data
The purpose of this task is for students to represent and interpret weather data, as well as answer questions about the data they have recorded. Student worksheets and recording sheet are included.
Texas Education Agency
Texas Gateway: Scientific Investigation and Reasoning Data Organization
Using interactive exercises, students will review how to construct tables and graphs in order to organize data.
Scholastic
Scholastic: Gather Data: Experiment With Weather
Simple guidelines for building several weather-related tools: anemometer, wind vane, barometer, rain gauge, snow gauge, and thermometer. After building your tools, follow experiment steps and record your findings on the Scholastic...
NOAA
Noaa: Chesapeake Bay Interpretive Buoy System: Data in the Classroom
NOAA Smart Buoys collect and transmit real-time weather, water conditions, and water quality data. Chesapeake Exploration gives teachers and their students unprecedented access to lessons designed around real-time observational data from...
Science Buddies
Science Buddies: Using Weather Balloon Data to Map Atmospheric Temperature
Snow-capped mountains make a picturesque scene, especially in summertime when the peaks are in such contrast to the warmth below. This project shows you a way to see how temperature changes with altitude using data collected twice daily...
NOAA
Noaa: Be a Citizen Weather Reporter [Pdf]
Report the local weather to your community after deciding which data to collect and reading some of the National Weather Service's forecasting tips for amateur weather reporters.
PBS
Pbs Learning Media: Daily and Seasonal Weather: Interactive Lesson
Students investigate the relationship between daily weather and seasonal weather. Students will read about how weather data is collected, then interpret examples of weekly and monthly weather data to find seasonal patterns. Visual...
Texas Instruments
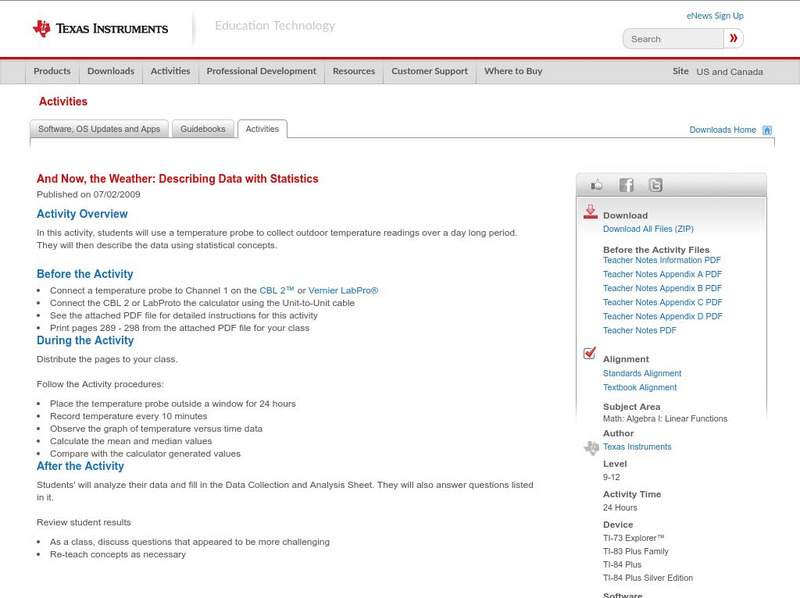
Texas Instruments: And Now, the Weather: Describing Data With Statistics
In this activity, students can use a temperature probe to collect outdoor temperature readings over a day long period. They will then describe the data Using statistical concepts.
Climate Literacy
Clean: Mauna Loa Co2 Collection Data
This data-intensive activity uses real world datasets to cover topics such as weather v. climate, air circulation around the globe, seasonal effects, and climate change.
NOAA
Noaa: Build Your Own Weather Station [Pdf]
Build six different instruments to collect meteorological data for the weather in your area.
University Corporation for Atmospheric Research
Ucar: Differences Between Climate and Weather
For this activity, students collect weather data over several days or weeks, graph temperature data, and compare the temperature data collected with averaged climate data where they live.


